Characteristics of Public and Private Elementary and Secondary School Principals in the United States: Results From the 2017–18 National Teacher and Principal Survey First Look: The National Teacher and Principal Survey (NTPS) collects data from public and private K-12 schools, principals, and teachers across the United States. Its data provides critical data on core topics such as school characteristics and services, principal and teacher demographics, and teacher preparation. The most recent 2017-18 report examined public (traditional), charter, and private school principals in terms of: race/ethnicity, age, highest college degree, salary, years experience (as a principal and at their current school), level of influence on decision-making, and experience with evaluations. A few of the more notable points include:
• Twenty-seven percent of school principals are 55 or older. This represents a significant number of principals who likely to retire in five years.
• The average salary for school principals is $ 92,900.
• Over ninety percent (91.7%) of school principals have a Master’s Degree or higher.
• Almost half (44.3%) of school principals have less than three years experience in their current schools.
• Seventy percent of school principals received evaluations in the selected year (79% in traditional public schools, 69% in charter schools, and 51% in private schools).
Citation: Taie, S., and Goldring, R. (2019). Characteristics of Public and Private Elementary and Secondary School Principals in the United States: Results From the 2017–18 National Teacher and Principal Survey First Look (NCES 2019- 141). U.S. Department of Education. Washington, DC: National Center for Education Statistics.
Matching the availability of teachers to demand constantly evolves. During recessions schools are forced to layoff teachers. As economic times improve, schools acquire resources and rehire personnel. Currently, American schools are faced with the most severe shortages in special education; science, technology, engineering, and math (STEM); and bilingual education. Shortages vary across the country and are most acute in areas with lower wages and in poor schools. Starting in the 1980’s schools began filling vacancies with under-qualified personnel hired on emergency or temporary credentials to meet needs. A 35% drop in pre-service enrollment and high teacher attrition currently impact the supply. Candidates and veteran teachers are influenced to leave teaching due to low compensation, stressful working conditions, and a perceived decline in respect. The demand side is influenced primarily by fluctuations in population, finances, and education policy. Matching supply to demand is a challenge but can be accomplished through better planning, procuring less volatile funding sources, and improving working conditions through improved pay and effective training.
Citation: Donley, J., Detrich, R. Keyworth, R., & States, J., (2019). Teacher Retention Analysis Overview. Oakland, CA: The Wing Institute. https://www.winginstitute.org/teacher-retention-turnover-analysis.
Characteristics of Public and Private Elementary and Secondary Schools in the United States: Results From the 2017–18 National Teacher and Principal Survey First Look. The National Teacher and Principal Survey (NTPS) collects data from public and private K-12 schools, principals, and teachers across the United States. Its data provides critical data on core topics such as school characteristics and services, principal and teacher demographics, and teacher preparation. The most recent 2017-18 report examined public (traditional), charter, and private schools in terms of their participation in the federal free or reduced-price lunch programs (FRLP), special education, English-language learners (ELLs) or limited-English proficient (LEP), extended school days, school start times, special emphasis schools, and minutes of instruction. One of the takeaways from the data is that public (traditional) and charter schools have almost identical statistics in these categories. Included in this data are the following:
Approximately 12% of all K-12 students have IEPs or formally identified disabilities: public (traditional) 13% schools, charter schools 11%, and private schools 7.5%. Ten percent of all K-12 students required ELL/LEP services: public (traditional) 10.6% schools, charter schools 10.2%, and private schools 2.6%.
The majority of public schools (96.6% of traditional public schools and 83.6% of charter schools) participated in the FLRP, with over half of all students receiving these services (55% of total students in each). Private schools were much less likely to participate, with only 18.8% of private schools and 8.7% of the served population receiving FRLP.
Citation: Taie, S., and Goldring, R. (2019). Characteristics of Public and Private Elementary and Secondary Schools in the United States: Results From the 2017–18 National Teacher and Principal Survey First Look (NCES 2019-140). U.S. Department of Education. Washington, DC: National Center for Education Statistics.
Teacher turnover has been a persistent challenge; while the national rate has hovered at 16% in recent decades, more teachers are leaving the profession, contributing to teacher shortages in hard-to-staff subjects and schools. Higher attrition rates coupled with disproportionate teacher movement away from schools in economically disadvantaged communities has resulted in inequitable distributions of high-quality teachers across schools. Teacher turnover is quite costly, and primarily has negative consequences for school operations, staff collegiality, and student learning. Turnover rates are highest among minority teachers working in high-need schools, beginning teachers, and those who are alternatively certified; higher rates are also found for those teaching math, science, and English as a foreign language, and for special education teachers. Teachers are less likely to be retained in schools with poor working conditions, particularly those led by principals perceived to be less effective, and in schools where they are paid less. Teacher retention may be improved with combinations of targeted financial incentives and improved working conditions (e.g., better principal preparation), and through better supports for early career teachers through effective induction and mentoring programs. Linking financial incentives with enhanced leadership opportunities and career paths also offer potential for retaining effective teachers in classrooms where they are most needed.
Do Test Score Gaps Grow Before, During, or Between the School Years? Measurement Artifacts and What We Can Know in Spite of Them. Concerns regarding gaps in student achievement for students of lower socio-economic status (SES) and students of color continue to concern educators and the public. One of the more influential studies to examine this issue was the Beginning School Study (BSS) of students in Baltimore City Public Schools in 1982 (Alexander and Entwisle, 2003). The authors found an achievement gap exists at the time student entered elementary school. More importantly, they conclude that the discrepancy in performance widened after each summer break, tripling in size by the end of middle school.
A more recent study published in 2019 by von Hippel and Hamrock offers evidence to counter the Alexander and Entwisle 2003 claims, suggesting that the growing gap is an artifact of the testing and the measurement methods used in the 2003 research. Von Hippel and Hamrock conclude the scaling method, Thurstone scaling (frequently used in the 1960s and 1970s), is flawed and is responsible for the original findings. The Thurstone scaling method has subsequently been replaced in research by more effective methods such as response theory (IRT). When the data from the study was reanalyzed using IRT, the gaps shrank. The new study concludes that gaps are already significant by the time children start school and remain relatively stable until graduation.
The von Hippel and Hamrock research looked at test score gaps for a range of populations: between boys and girls; between black, white, and Hispanic children; between the children and the mother’s education; between children in poor and nonpoor families; and the gaps between high-poverty and low-poverty schools. The researchers wanted to know whether gaps grow faster during summer or the school year. They were unable to answer this question as the results were inconclusive. Although, von Hippel and Hamrock did find the total gap in performance from kindergarten to eighth grade, is substantially smaller than the gap that exists at the time children enter school.
Von Hippel and Hamrock highlight two measurement artifacts that skewed Alexander and Entwisle results: test score scaling and changes of test content. Scaling is a mathematical method that transforms right and wrong answers into a test score. Not all scales produce the same results with important implications for whether and when score gaps happen. Along with concluding that a gap between SES populations tripled between first and eighth grade, Alexander and Entwisle found it was summer vacations where the real gap increased each year. Von Hippel and Hamrock found the BSS used CAT Form C, which was a “fixed-form” paper test. In first grade, all BSS children took a test that contained a fixed or unvarying set of questions in fall and spring. This makes sense when you want to know if students are meeting learning expectations over a specific grade.
But the Alexander and Entwisle wanted to understand the impact of summer breaks on learning, not during a school year. To obtain this information they were used a test designed for the first grade taken at the end of the school year and compared it to the second-grade test given in the fall. Using the spring test of first grader knowledge, then switching the test to the second-grade test in the fall to measure performance the impact of summer break has the effect of confounding summer learning results. Von Hippel and Hamrock propose that changing the test form had the possible effect of distorting the results. Alexander and Entwisle was not the only seasonal learning study to use fixed forms that changed after the summer. Using fixed form tests was a common practice for research from the 1960s into the 1990s. Von Hippel and Hamrock study suggests the summer learning literature was potentially vulnerable to artifacts related to scaling and changes of test form.
Fixed form tests have been replaced by the use of adaptive tests less vulnerable to artifacts that might affect summer learning. Adaptive tests do not ask the same questions of all students. Adaptive tests measure ability by increasing the difficulty of questions asked of students based on the student’s earlier performance. Hence, adaptive tests are a better tool to gauge the impact of summer on student achievement.
The von Hippel and Hamrock study concludes that gaps grow fastest in early childhood. They find no evidence of a gap doubling between first grade and eighth grade and some disparities even shrank. The summer gap growth does not hold up when the flawed instrument is replaced with adaptive tests scored using IRT ability scales. When summer learning gaps are present, most of them are small and not easily detectable. The conclusion is that gaps happen mostly in the first five years of life. Resources currently used to solve a summer learning gap that doesn’t appear to exist should be redirected toward early childhood education. Von Hippel and Hamrock’s study suggests students who are behind peers at the time they enter kindergarten should receive early remedial instruction as the most efficacious way to improve overall performance.
Citation: von Hippel, P. T., & Hamrock, C. (2019). Do test score gaps grow before, during, or between the school years? Measurement artifacts and what we can know in spite of them. Sociological Science, 6, 43-80.
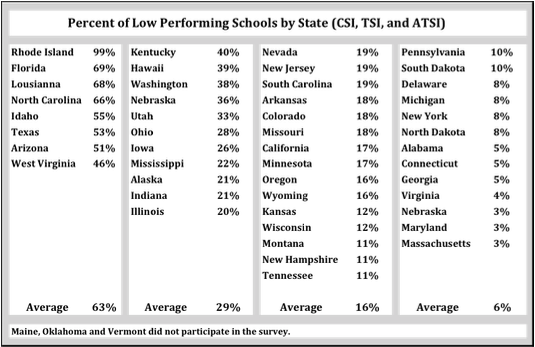
The Number of Low-Performing Schools by State in Three Categories (CSI, TSI, and ATSI), School Year 2018-19. Every Student Succeeds Act (ESSA) gives individual states significant flexibility as to how they identify “low performing schools”. This decision is extremely important as low performing school triggers mandates for states and districts to invest resources to improve them. The more schools identified, the bigger the responsibilities. ESSA identifies three categories of low-performing schools. Going from most intensive to least they include: Comprehensive Support and Improvement (CSI) schools, Targeted Support and Improvement (TSI) schools, and Additional Targeted Support and Improvement (ATSI) schools.
Ideally, each state would have consistent standards for identifying schools that are low performing. To date, there is no formal system in place to monitor these new standards. This report, completed by the Center on Education Policy, attempts to provide an initial snapshot of the number and percentages of schools each state has identified low performing. It has limitations in that states are in the early stages of implementation and calibration, states offered various degrees of cooperation, and some states had yet to complete implementation. Still, it does provide an early look at a very diverse set of guidelines.
The following chart captures their results.
Center on Education Policy (2019)
The data show a wide range of results in terms of the percentage of schools identified as low performing. The overall range is 3% to 99%, with individual states spread out fairly evenly in between. Eight states identified over 40% of their public schools as low performing, eleven states 20%–40%, fifteen states 11%–19%, and thirteen states 3%–10%. Even with the limitations of the data listed above, this data suggests inconsistent standards across states.
Citation: Stark Renter, D., Tanner, K., Braun, M. (2019). The Number of Low-Performing Schools by State in Three Categories (CSI, TSI, and ATSI), School Year 2018-19. A Report of the Center on Education Policy
Are Students with Disabilities Accessing the Curriculum? A Meta-analysis of the Reading Achievement Gap between Students with and without Disabilities. A critical goal of federal education policy is improving students with disabilities participation in grade level curriculum. This meta-analysis examines 23 studies for student access to curriculum by assessing the gap in reading achievement between general education peers and students with disabilities (SWD). The study finds that SWDs performed more than three years below peers. The study looks at the implications for changing this pictures and why current policies and practices are not achieving the desired results.
Citation: Gilmour, A. F., Fuchs, D., & Wehby, J. H. (2018). Are students with disabilities accessing the curriculum? A meta-analysis of the reading achievement gap between students with and without disabilities. Exceptional Children. Advanced online publication. doi:10.1177/0014402918795830
Do Charter Middle Schools Improve Students’ College Outcomes? This study examines the impact of Charter schools on college enrollment. The National Center for Education Evaluation and Regional Assistance (NCEE) used college enrollment and completion data for students who (more than a decade ago) entered lotteries to be admitted to 31 charter middle schools across the United States. College outcomes were compared for 1,723 randomly selected “lottery winners” and 1,150 randomly selected “lottery losers”. The results show that admission to a charter middle school did not affect college outcomes. Additionally, the study finds no consistent relationship between the impact a charter middle school achievement and the school’s impact on college outcomes
Citation: Place, K., & Gleason, P. Do Charter Middle Schools Improve Students’ College Outcomes? (Study Highlights) (No. 61bd53574633412b9136328cb4e143ef). Mathematica Policy Research.
Principal Pipeline: A Feasible, Affordable, and Effective Way for Districts to Improve Schools. The Rand Corporation just released its report evaluating the impact of the Principal Pipeline Initiative (PPI),a project supported by the Wallace Foundation to create and implement a strategic process for school leadership talent management. PPI was operated from 2011 to 2016 in six large school districts. It was composed of leadership standards, pre-service preparation opportunities for assistant principals and principals, selective hiring and placement, and on-the-job induction, evaluation and support. The Rand Study evaluated PPI’s feasibility, effectiveness, and affordability. It concluded that the model was feasible as each participating district was able to implement all components of the model at scale in different ways depending on the unique aspects of the district. From an effectiveness standpoint, newly placed principals in PPI districts had a greater statistically significant impact on student reading and math scores than non-PPI principals, they were more likely to stay ion their schools for at least two years, and the novice principals rated the program’s hiring, evaluation, and support process higher than non-participating principals rated the baseline model. And finally, the study found the model affordable at $ 42 per student per year, which represented a significant return on investment. Note: It is hoped that future studies will include outcome measure such as teacher retention, effectiveness, and satisfaction in the context of principal development.
Citation: Gates, Susan M., Matthew D. Baird, Benjamin K. Master, and Emilio R. Chavez-Herrerias, Principal Pipelines: A Feasible, Affordable, and Effective Way for Districts to Improve Schools, Santa Monica, Calif.: RAND Corporation, RR-2666-WF, 2019.
The Link Between School Attendance and Good Health. The American Academy of Pediatrics just released a policy statement regarding the negative impact that chronic student absenteeism has on children’s health. They cite numerous ways the two are linked. First, evidence clearly documents that chronic absenteeism puts children at a much higher risk of dropping out of school and not graduating. There is a significant amount of research associating poor school performance (resulting in lower education attainment) and poor adult health outcomes, including increased mortality risk and lower life expectancy. The act of missing school itself is also linked to increased risk behaviors, including alcohol consumption, drug use, smoking and risky sexual behavior. Also, children with chronic absenteeism are 3.5 times more likely to be arrested or referred to the juvenile justice system. The policy statement finishes with a discussion of roles the medical community can play working with schools and families to help address this problem. It reviews the evidence regarding possible physical and mental health interventions, including: infection prevention programs, school nurses, school-based health centers, mental health care, health awareness school policies and programs, parent interventions, and coordinated school health models.
Citation: Allison, M. A., & Attisha, E. (2019). The Link Between School Attendance and Good Health. Pediatrics, e20183648.