Categories for Structural Interventions
January 23, 2020
Why is this question important? Given the limited resources that are available for the education of children, it is important to select interventions that have the greatest impact we can afford. Using Stuart Yeh’s effectiveness cost ratio formula, a rough comparison can be drawn comparing class size reduction with other educational interventions.
Citation: Yeh, S. S. (2007). The Cost-Effectiveness of Five Policies for Improving Student Achievement, American Journal of Evaluation, 28(4), 416-436.
Link: https://www.winginstitute.org/how-does-class-size
January 15, 2020
Does School Spending Matter? The New Literature on an Old Question. The impact of school finances on student achievement has long interested educators. Research conducted before the mid-1990s suggested a link between the available resources provided schools and student outcomes, but much of this research is correlational. Because correlational research cannot imply causation, studies of a more rigorous nature are needed if policymakers are to redesign school financing that predictably maximizes learning for all students, regardless of the parent’s socio-economic status. Recently published studies employing larger data-sets and based on quasi-experimental methods offer a clearer understanding of how schools might be better funded. This paper of American United States school finances finds evidence to support the importance of providing equitable funding across school districts. These results have important policy implications and suggest areas for future research.
Citation: Jackson, C. K. (2018). Does school spending matter? The new literature on an old question (No. w25368). National Bureau of Economic Research.
Link: https://pdfs.semanticscholar.org/0fe6/d628994e0fdc26a605cbf13d98929b94bb53.pdf?_ga=2.32626302.115129415.1578943387-1285604847.1578943387
December 17, 2019
Practice Outpacing Policy? Credit Recovery in American School Districts. Traditionally, students who failed classes could get credit by taking the class over during summer school. In a relatively brief period of time, most high schools have a undergone a complete and rapid transformation in this area, shifting to “credit recovery” programs to help at-risk students earn credits towards graduation for classes they have failed. These programs typically offer online alternatives to students rather than having them retake the failed class. In the 2015-16 school year approximately three out of four high schools offered credit recovery programs with about 6% of all students participating. This growth in credit recovery programs, rapid expansion of new online models, and numerous cases of misuse to inflate graduation rates highlight the need for research into the implementation and effectiveness of this intervention.
This study examined the policies and practices of a representative sample of high schools to identify how they structure their credit recovery programs. It found: Over 95% of the credit recovery program had online components (58% online with some in-person instruction, 37% were exclusively online). Seventy-eight percent used just one online credit recovery provider to manage their system. Eighty-seven percent of districts offer credit recovery programs year-round. Forty percent of the districts limited credit recovery to courses
Traditionally, students who failed classes could get credit by taking the course over during summer school. In a relatively brief time, most high schools have undergone a complete and rapid transformation in this area, shifting to “credit recovery” programs to help at-risk students earn credits towards graduation for classes they have failed. These programs typically offer online alternatives to students rather than having them retake the failed class. In the 2015-16 school year, approximately three out of four high schools offered credit recovery programs with, about 6% of all students participating. This growth in credit recovery programs, a rapid expansion of new online models, and numerous cases of misuse to inflate graduation rates highlight the need for research into the implementation and effectiveness of this intervention
This study examined the policies and practices of a representative sample of high schools to identify how they structure their credit recovery programs. It found: Over 95% of the credit recovery program had online components (58% online with some in-person instruction, 37% were exclusively online). Seventy-eight percent used just one online credit recovery provider to manage their system. Eighty-seven percent of districts offer credit recovery programs year-round. Forty percent of the districts limited credit recovery to courses required for graduation. Only 16% limited the option to twelfth graders, allowing students from all high school grades to avail themselves of the option. The study concluded that “many districts’ policies allow lots of flexibility for student access and assessment with relatively little constraint. Taken individually, these policies could be justifiable but taken together, and they leave credit recovery programs ripe for abuse.”
Citation: Malkus, N. (2019). Practice Outpacing Policy? Credit Recovery in American School Districts. American Enterprise Institute.
Web Address: https://www.aei.org/wp-content/uploads/2019/11/Practice-Outpacing-Policy.pdf
December 16, 2019
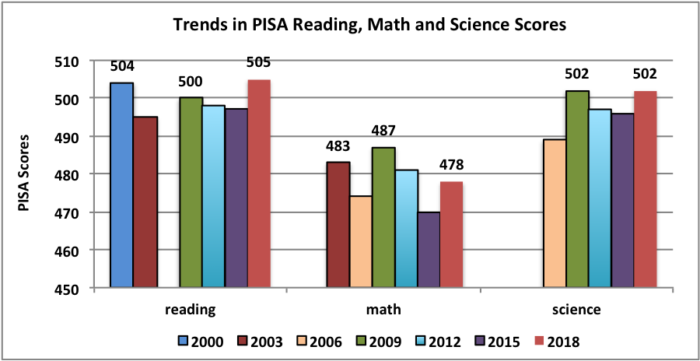
PISA 2018 Results (Volume I): What Students Know and Can Do. Benchmark Indicators are critical tools to help education stakeholders track their education system’s performance over time, in comparison to other similar level education systems (state, national, international), and by student groups (ethnicity, disabilities, socioeconomic status, etc.). One of the most respected tools for benchmarking system performance is the Program for International Student Assessment (PISA), which tests 15-year-old-students across nearly 80 countries and educational systems in reading, mathematics, and science. The results from the most recent testing (2018) were just released. The report itself has an enormous amount of data. A summary of key findings follows.
Performance Over Time
U.S. test performance, despite small fluctuations, has been virtually flat over the past twelve to eighteen years (depending on the subject area). The reading performance score was 504 in 2000 and 505 in 2018. Math performance got worse, dropping from 483 in 2003 to 478 in 2018. And science performance has remained the same over the last four testing periods, remaining at 502 between 2009 and 2018. Consistency is not inherently a bad thing depending on how well a system is performing. However, PISA data suggests that the U.S. system is significantly underperforming compared to other international systems (see following). Consistency is also a problem when one considers that unprecedented investments in school reform efforts during this time period (e.g. No Child Left Behind, School Improvement Grants, Race to the Top, and Every Student Succeeds) have failed to move the needle in any significant way.
Performance Compared to Other Countries
U.S performance in reading ranked thirteenth among participating nations in reading, thirty-eighth in math, and twelfth in science. These represent a slight improvement in rankings from the 2015 test results, but that is a reflection of several top performing nations had lower scores, not that the U.S. improved.
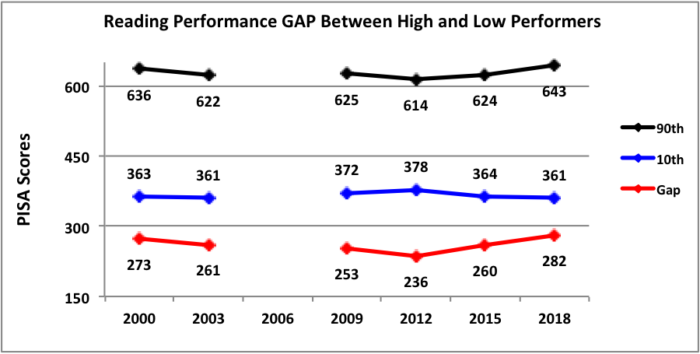
Performance Across Different Student Subgroups
One of the biggest takeaway’s from this report is the growing inequity in performance between the high student performers and low. The following chart looks at the average scores of a gap between student scores in the highest percent of academic achievement (90%) and scores at the lowest (10%).
Reading scores of the highest performing students have increased over the lasts two tests from 614 to 643, while the scores of the lowest 10% have decreased from 378 to 361. The result is a widening gap between the top and lowest performing students. While improving the scores of the best performing students is a laudable achievement, an education system must serve all of its students in the interest of equity.
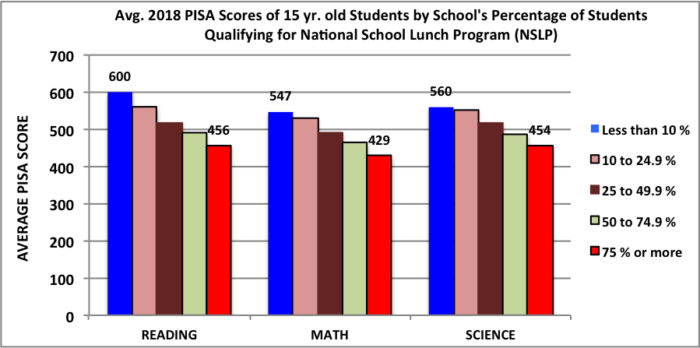
Further analysis of the data shows a correlation between student performance differences and their socioeconomic status (SES). One of the metrics used to determine SES is whether or not students qualify for the National School Lunch Program.
This data shows a direct correlation between a school’s reading scores and the SES of its student body. The more low SES students, the lower the PISA reading, math, and science scores.
It is almost impossible to document cause and effect with data at this level of analysis and control. Still, when making policy and program decisions, we must use the best available evidence. In this case, the best available evidence portrays an education system that, despite significant school improvement efforts, has shown little or no improvement over time, performs worse than a significant number of other nations’ education systems and continues to have inequitable results.
Citation. OECD (2019), PISA 2018 Results (Volume I): What Students Know and Can Do, PISA, OECD Publishing, Paris, https://doi.org/10.1787/5f07c754-en.
Web Address. https://www.oecd.org/pisa/publications/pisa-2018-results-volume-i-5f07c754-en.htm
October 24, 2019
Small class sizes for improving student achievement in primary and secondary schools: a systematic review. This Campbell Collaboration systematic review examines the impact of class size on academic achievement. The review summarizes findings from 148 reports from 41 countries. Reducing class size is viewed by many educators as an essential tool for improving student performance, and is especially popular among teachers. But smaller class sizes come at a steep cost. Education policymakers see increasing class size as a way to control education budgets. Despite the real policy and practice implications, the research on the educational effects of class‐size differences on student performance is mixed. This meta-analysis suggests, at best only, a small impact on reading achievement. The study finds a small negative effect on mathematics. Given the fact that class size reduction is minimally effective while being costly, aren’t there better solutions that are both cost-effective, benefits students, and can help teachers be successful in a very challenging profession?
Citation: Filges, T., Sonne‐Schmidt, C. S., & Nielsen, B. C. V. (2018). Small class sizes for improving student achievement in primary and secondary schools: a systematic review. Campbell Systematic Reviews, 14(1), 1-107.
Link: https://onlinelibrary.wiley.com/doi/full/10.4073/csr.2018.10
October 15, 2019
The effect of charter schools on student achievement. Charter schools increasingly play a prominent role in educating students in the United States. Given the vast resources allocated to charter schools, it is imperative the question is asked, How effective are these schools in comparison to traditional public schools? This meta-analysis focuses on student math and reading performance. The authors found an overall effect size for elementary school reading and math of 0.02 and 0.05 and middle school math of 0.055. Effects were not statistically meaningful for middle school reading and high school math and reading. The study offers compelling evidence that charters under-perform traditional public schools in some locations, grades, and subjects, and out-perform traditional public schools in other geographical locations, grades, and subjects. The mixed results are not surprising as there is no set management model, quality of personnel, curricula, or pedagogy that distinguishes charter schools from public schools. The study did find a small positive effect size for KIPP charter schools. The absence of significant achievement gains attributed to charter schools should concern school systems considering expanding the number of charter schools as a solution to underperforming schools.
Citation: Betts, J. R., & Tang, Y. E. (2019). The effect of charter schools on student achievement. School choice at the crossroads: Research perspectives, 67-89.
Link: https://files.eric.ed.gov/fulltext/ED526353.pdf
October 7, 2019
Public Accountability and Nudges: The Effect of an Information Intervention on the Responsiveness of Teacher Education Programs to External Ratings. Teacher preparation programs (TEP) have received a great deal of research and policy attention as a potential driver of improvements in teacher quality and improved student outcomes. This paper presents research on external ratings of teacher education programs (TEPs) produced by the National Council on Teacher Quality (NCTQ) and the results of an experiment to improve school rankings by providing information and feedback to TEPs about how to improve their ratings. Research suggests that higher education institutions are responsive to feedback and public ratings. The college rankings published by U.S. News and World Report (USNWR) shows how powerful ratings can be in changing higher education practices such as admissions requirements, financial aid disbursements, and policies. NCTQ released the first ranking of TEP’s in 2014 as a part of an ongoing effort to rate teacher training nationally. The intervention relied upon providing targeted information about specific programmatic changes that would improve the rating for a randomly selected sample of elementary teacher education programs. Average program ratings improved between 2013 and 2016, but we find no evidence that the information intervention increased program responsiveness to NCTQ’s rating effort. The results show that the experimental group had lower ratings than the control group in 2016.
Citation: Goldhaber, D., & Koedel, C. (2019). Public Accountability and Nudges: The Effect of an Information Intervention on the Responsiveness of Teacher Education Programs to External Ratings. American Educational Research Journal, 0002831218820863.
Link: https://files.eric.ed.gov/fulltext/ED583637.pdf
October 7, 2019
Decades of data attest to high rates of teacher turnover. Almost half of new teachers leave the profession within 5 years. For the past 10 years, turnover has leveled off at a disconcerting 16% per year. High turnover impedes student performance and diverts resources away from efforts to improve schools. It places large numbers of inexperienced, less effective teachers in classrooms, resulting in increased recruiting, hiring, and training budgets. With effective retention, the United States could save a meaningful portion of the $2.2 billion spent annually on replacing teachers. Research shows that increases in teacher turnover consistently correspond with decreases in achievement in core academic subjects. Attrition disproportionately affects schools with the greatest needs, low-achieving and high-poverty schools. Chronic turnover also negatively impacts a school’s culture, increasing student disciplinary problems and principal turnover. It damages collegiality, adding chaos and complexity to schoolwide operations and perpetuating new cycles of turnover. Effective interventions can remediate this situation, but they require administrators’ long-term commitment to improve the learning environment and working conditions.
Citation: Donley, J., Detrich, R, Keyworth, R., & States, J. (2019). Teacher Turnover Impact. Oakland, CA: The Wing Institute. https://www.winginstitute.org/teacher-retention-turnover
Link: https://www.winginstitute.org/teacher-retention-turnover
October 1, 2019
Single‐track year‐round education for improving academic achievement in U.S. K‐12 schools: Results of a meta‐analysis. This Campbell Collaboration systematic meta-analysis examines the impact of reducing summer breaks on student academic performance. Research shows that students experience a loss in math and reading performance over summer breaks. Year‐round education (YRE) redistributes schooldays to shorten summer. This study finds that students at single‐track YRE schools show modestly higher achievement in both math and reading. The higher achievement is similar to estimates of summer learning loss. The effects were similar for all students. Given that summer learning loss is thought to be greater among students from disadvantaged groups, the estimated impact for low‐income and minority students were found to unexpectedly be about the same magnitude or smaller than for the full sample.
Citation: Fitzpatrick, D., & Burns, J. (2019). Single‐track year‐round education for improving academic achievement in US K‐12 schools: Results of a meta‐analysis. Campbell Systematic Reviews, 15(3), e1053.
Link: https://onlinelibrary.wiley.com/doi/full/10.1002/cl2.1053 and https://onlinelibrary.wiley.com/doi/epdf/10.1002/cl2.1053
August 29, 2019
The Feasibility of Collecting School-Level Finance Data: An Evaluation of Data from the School-Level Finance Survey (SLFS) School Year 2014–15. Few things are more complicated nor critical than collecting accurate and meaningful data on school finances at the individual school level. It is complicated because of the sheer size of the education system, diversity of spending categories, differing state laws and regulations governing finances, and accounting systems not designed for this task. It is critical because the education system puts high value on equitable and adequate funding for all students. Tracking spending at the individual school level is also a requirement of the recently enacted Every Student Succeeds Act.
This research and development report field-tested a new model for collection of finance data at the school level—the School- Level Finance Survey (SLFS). The pilot SLFS, collected for fiscal year (FY) 14 (school year 2013–14) and FY 15 (school year 2014–15), was designed to evaluate whether the survey is a viable, efficient, and cost-effective method to gather comparable school-level finance data. The results suggest that, regardless of the inherent challenges, it is highly feasible to collect and report on school-level finance data with acceptable accuracy. It also projects improved response rates and the increased availability of complete, accurate, and comparable finance data at the school level as the number of states participating in the SLFS increases and the collection continues to expand.
Citation: Cornman, S.Q., Reynolds, D., Zhou, L., Ampadu, O., D’Antonio, L., Gromos, D., Howell, M., and Wheeler, S. (2019). The Feasibility of Collecting School-Level Finance Data: An Evaluation of Data From the School- Level Finance Survey (SLFS) School Year 2014–15 (NCES 2019-305). U.S. Department of Education. Washington, DC: National Center for Education Statistics.
Link: https://nces.ed.gov/pubs2019/2019305.pdf