Categories for Structural Interventions
January 31, 2019
Digest of Education Statistics 2017: The Digest of Education Statistics 2017was just released by The Institute for Education Sciences (IES) National Center for Education Statistics (NCES). This annual publication is thedefinitive compendium of data on virtually every aspects of education from pre-kindergarten through graduate school. Its chapters include: All Levels of Education, Elementary and Secondary Education, Postsecondary Education, Federal Funds for Education and Related Activities, Outcomes of Education, International Comparisons of Education, and Libraries and Use of Technology. It draws from a wide range of government and private sources and applies rigorous review to everything published. It has been published annually since 1962, providing over 50 years of data with which to benchmark education performance at the system level in this country.
Citation: Snyder, T.D., de Brey, C., and Dillow, S.A. (2019). Digest of Education Statistics 2017 (NCES 2018-070). National Center for Education Statistics, Institute of Education Sciences, U.S. Department of Education. Washington, DC.
Link: https://nces.ed.gov/pubs2018/2018070.pdf
January 31, 2019
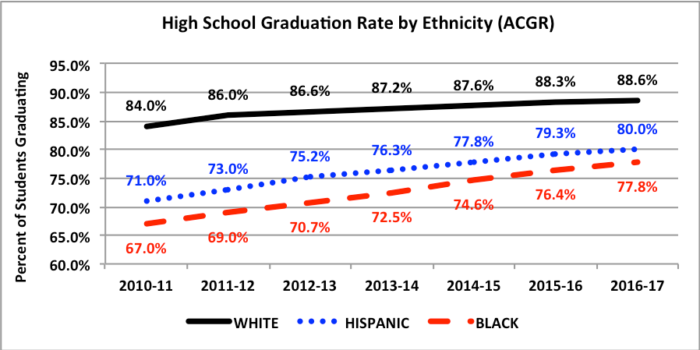
Digest of Education Statistics 2017. The most recent high school graduation rate data were just released for the 2016-17 school year. The following graph shows consistent improvement in this critical student and school performance metric. Student graduation increased by 12 percentage points during the fifteen years from 2002 and 2017. While there is still much work to be done to identify and implement graduation standards that translate into meaningful and life long benefits, this type of consistent performance improvement should be acknowledged.
•AFGR: The Average Freshman Graduation Rate (AFGR) was used by the U.S. Department of Education (DOE) from 2002 through 2013.
•ACGR: The Four-Year Adjusted Cohort Graduation Rate (ACGR) was established by DOE in 2008, establishing a uniform and more accurate measure for calculating the rate at which students graduated from high school.
Both models co-existed for threes years and had comparable graduate rate data during that time.
A second area of the report disaggregates graduation rate data by students from different ethnic backgrounds. There remains an unacceptable graduation rate gap between White and Black students, and White and Hispanic students. The resulting graduation rate for Black students (77.8%) and Hispanic students (80.0%) are failures of the system. While progress will always be too slow in this area, the data do show steady progress in closing the gap over the last six years. The graduation gap between White and Black students decreased by 6.2 percentage points (from 17% in 2010-11 to 10.8% in 2016-17). The graduation gap between White and Hispanic students decreased by 4.4 percentage points (from 13% in 2010-11 to 8.6% in 2016-17).
A third area of disaggregated data was that of graduation rates by individual states. The variation between states continues to be extreme with the top ten states averaging a 89.7% graduation rate and the bottom ten states averaging 77.4%.
Improving graduation rates continue to be a clear focus of the education system, and while there is a long way to go, it is one of the few areas where progress is being made.
Citation: Snyder, T.D., de Brey, C., and Dillow, S.A. (2019). Digest of Education Statistics 2017 (NCES 2018-070). National Center for Education Statistics, Institute of Education Sciences, U.S. Department of Education. Washington, DC.
Link: https://files.eric.ed.gov/fulltext/ED592104.pdf
December 21, 2018
“Trends in High School Dropout and Completion Rates in the United States: 2018”. Dropping out of high school has significant negative impacts on students. Statistically, they will have lower earnings than high school graduates, are more likely to be unemployed, have poorer health, and have a higher rate of incarceration. This report provides a detailed analysis of long-term dropout and completion trends and student characteristics of high school dropouts and completers. The first measure examined was the “event dropout rate” which is the percent of students who drop out in grades 10-12 without a high school diploma or alternative credential. The event dropout rate for SY 2015-16 was 4.8%, which translated into 532,000 students.
The 40 year trend show an alarming lack of progress. While 2015-16 was lower than in 1976 (5.8%), it reflects a worsening over the last ten years (increasing from 3.8% to 4.8%). Of all of the student demographic data, the clearest impact was that of family income. Students from the lowest income families had a 7.2% dropout rate compared to 3.9% for highest income families. The “adjusted cohort graduation rate” for 2015-16 was 84% which showed steady improvement over the past five years. The main problem is the significant differences in graduate rates across race, economic status, states, and disabilities. For example, graduation rates for white students ranged from 76% in New Mexico to 94% in New Jersey; black students from 57% in Nevada to 88% in West Virginia; Hispanic students from 65% in Minnesota to 89 % in Vermont.
Citation:
McFarland, J., Cui, J., Rathbun, A., and Holmes, J. (2018). Trends in High School Dropout and Completion Rates in the United States: 2018 (NCES 2019-117). U.S. Department of Education. Washington, DC: National Center for Education Statistics. Retrieved December 14, 2018 from http://nces.ed.gov/pubsearch.
Link: https://nces.ed.gov/pubs2019/2019117.pdf
December 12, 2018
Do students benefit from longer school days? Regression discontinuity evidence from Florida’s additional hour of literacy instruction: This research examines the impact of longer school days on student achievement. The amount of time available for instruction has a role to play in student learning. Insufficient instruction would appear to have an effect on learning, but the current knowledge-base on this topics is insufficient. This study attempts to fill in gaps in the evidence-base on this topic. The results indicate significant positive effects of additional literacy instruction on student reading achievement. Although this study finds positive outcomes for additional reading instruction, it is important to note that for achieving maximum results it is important to pair evidence-based reading instruction practices with the additional instruction time in order to achieve maximum results.
Citation:Figlio, D., Holden, K. L., & Ozek, U. (2018). Do students benefit from longer school days? Regression discontinuity evidence from Florida’s additional hour of literacy instruction. Economics of Education Review, 67, 171-183.
Link: https://www.sciencedirect.com/science/article/abs/pii/S0272775718303662
December 6, 2018
The Learning Styles Educational Neuromyth: Lack of Agreement Between Teachers’ Judgments, Self-Assessment, and Students’ Intelligence. The issue of learning styles (LS) have been overwhelmingly embraced by teachers and the public for over forty years. International surveys of teachers have shown more than 90% believe that grouping students into categories, like auditory, visual, or kinesthetic learners, or concrete versus abstract learners will enhance student achievement. This study examined the hypothesis that teachers’ and students’ assessment of preferred LS correspond. The study found no relationship between pupils’ self-assessment and teachers’ assessment. Teachers’ and students’ answers didn’t match up. The study suggests that teachers cannot assess the LS of their students accurately. This is important because if teachers cannot accurately identify which style is preferred, they cannot assign the appropriate curriculum to each student. For a thorough summary on research on this topic the article by Daniel Willingham, “Does Tailoring Instruction to Learning Styles Help Student Learn?” offers arguments for and against LS. At this time the preponderance of evidence finds learning styles to have no basis in fact, despite the very strong and persistent preference teachers and the public have for the concept.
Citation:Papadatou-Pastou, M., Gritzali, M., & Barrable, A. (2018). The Learning Styles Educational Neuromyth: Lack of Agreement Between Teachers’ Judgments, Self-Assessment, and Students’ Intelligence. Front. Educ. 3:105. doi: 10.3389/feduc.2018.00105
Link: https://www.frontiersin.org/articles/10.3389/feduc.2018.00105/full
December 5, 2018
Accountability policies and teacher decision making: Barriers to the use of data to improve practice. Underlying many accountability policies is the assumption that standardized test data and other common sources of data will be used to make decisions that will result in changes to instructional practices. This study examines longitudinal from nine high schools nominated as leading practitioners of Continuous Improvement (CI) practices. The researchers compared continuous improvement best practices to teachers actual use of data in making decisions. The study found teachers to be receptive, but also found that significant obstacles were interfering with the effective use of data that resulted in changes in instruction. The analysis showed cultural values and practices inconsistent with accountability policies and continuous improvement practices impede implementation. The researchers identify barriers to use of testing and other data that help to account for the less than successful results. Given the current understanding of the importance on implementation science in the effective application of any new practice, these findings are not a surprise. As our colleague, Ronnie Detrich, is quoted as saying, “Implementation is where great ideas go to die”.
Citation: Ingram, D., Louis, K. S., & Schroeder, R. G. (2004). Accountability policies and teacher decision making: Barriers to the use of data to improve practice. Teachers College Record, 106(6), 1258-1287.
Link: Accountability policies and teacher decision making: Barriers to the use of data to improve practice
November 28, 2018
Seven Trends: The Transformation of the Teaching Force—Updated October 2018
Teachers play a crucial role in education, make up one of the largest workforces in the country, and require significant resources to support. As a result, tracking trends and changes in the demographic characteristics becomes critically important as education systems allocate existing resources and plan for the future. This study examines the most recent data from staffing surveys conducted by the National Center for Education Statistics (NCES), as well as those going back to 1987. Its concludes that over the last three decades the teaching force has become: 1) larger, 2) grayer, 3) greener, 4) more female, 5) more diverse by race-ethnicity, 6) consistent in academic ability, and 7) unstable. It also calls for more research as to the reasons for these trends and their implications and consequences.
A few highlights include: The rate of increase for teachers has far outpaced the rate of increase for students. The student population has grown by 24% over this period of time while the teacher workforce has grown by 65%. The workforce is growing both grayer (retirements have steadily increased) and greener (the modal public school teacher was in their first three years of teaching. It is has an increasing percent of female teachers (76.6%) as well minority teachers (growth in the number of minority teachers was more than three times the growth rate of white teachers). The field still suffers from extremely high turnover, with 44.6 % of new teachers leaving their jobs in less than five years.
Citation: Ingersoll, Richard M.; Merrill, Elizabeth; Stuckey, Daniel; and Collins, Gregory. (2018). Seven Trends: e Transformation of the Teaching Force – Updated October 2018. CPRE Research Reports.
Link: https://repository.upenn.edu/cgi/viewcontent.cgi?article=1109&context=cpre_researchreports
October 29, 2018
The teacher pay penalty has hit a new high: Trends in the teacher wage and compensation gaps through 2017
Given that evidence clearly shows teachers as having the single greatest school-based impact on student learning, it becomes crucial that schools recruit and retain high quality teachers. A key component to this involves teacher wage and benefit packages. This study concludes that teacher compensation is falling further and further behind that of comparable career opportunities each year. One metric that can be used to study this issue over time is “relative teacher pay”—teacher pay compared with that of other career opportunities for potential and current teachers. This is referred to as the “teacher wage penalty” which calculates wage gaps as a percentage of difference. The study concludes: The teacher pay penalty has been steadily worsening over the last two decades, increasing from a -1.8% wage gap in 1994 to a wage gap of -18.7% in 2017. While weekly wages for comparable jobs increased from $ 1,339 to $ 1,476 over this period of time, teacher weekly wages actually decreased $ 27 from $ 1,164 to $ 1,137. This gap varies significantly between the genders (-15.6% for women and -26.8% for men), across states (from a .3.1% for Wyoming to -36.4% Arizona). The study also downplays the impact of the recent recession on this trend, highlighting the impact of state government decisions on reducing education funding.
Citation: Allegretto, S.& Mishel, L. (2018). The teacher pay penalty has hit a new high: Trends in the teacher wage and compensation gaps through 2017. Washington DC: Economic Policy Institute.
Web Address: https://www.epi.org/files/pdf/153196.pdf
https://www.epi.org/publication/teacher-pay-gap-2018/
October 2, 2018
Formal Teacher Evaluation
This paper examines formal teacher evaluation. Formal teacher evaluation is integrated into many state and district policies, and, even with shifts in federal focus under ESSA, is likely to remain common practice. The goal of formal teacher evaluation is to collect data that accurately represents teacher practice and the connection to student achievement in a valid and reliable way, and use that information to improve the system for teaching and learning. Although conclusions about the impact of teacher evaluation on student achievement are mixed (Stecher et al., 2018; Taylor & Tyler, 2012a, 2012b), ideally collecting and using information about teacher practice can advance the conversation about quality instruction and teaching potential.
Citation: Cleaver, S., Detrich, R. & States, J. (2018). Overview of Teacher Formal Evaluation. Oakland, CA: The Wing Institute. https://www.winginstitute.org/teacher-evaluation-formal.
Link: https://www.winginstitute.org/teacher-evaluation-formal
September 10, 2018
A Review of the Relationship Between Parental Involvement Indicators and Academic Achievement
This review examines the relationship between parental involvement and student academic achievement. The definition of parental involvement isn’t always clear and encompasses a wide range of parental interventions and involvement in a child’s education. Two types of parental involvement are generally examined in the available research: home-based strategies, such as providing structure and support for learning and education at home, and school-based strategies, such as communicating with teachers and attending school events.
- Parental involvement and early childhood academic achievement(22 studies)
The majority of studies reported small to medium positive effect sizes on achievement for parental interventions in early childhood. When parents engage with preschoolers in learning activities at home, academic achievement improves. Research suggests that enriching activities such as telling stories, teaching letters and numbers, engaging in problem-solving activities, singing songs, and playing games improve children’s literacy skills. Research on parental involvement in school revealed mixed results depending on the type of involvement.
- Parental involvement and academic achievement for elementary school children(22 studies)
The majority of studies of elementary school children that examined the link between parental involvement and school achievement found a small to medium impact in math and reading. Not all studies reported positive outcomes and a small number reported a negative relationship to student achievement. It is important to note that outcomes for parental involvement varied according to the form of parental activity being examined.
This review found that parents’ educational expectations were the strongest predictor of academic achievement for elementary school children. Negative outcomes were associated with parents applying academic pressure in the form of commands, punishment, or coercive interactions. On the other hand, positive parental engagement, such as praising children’s performance, progress, and efforts and letting children know they cared about them and their school performance, was related to improved academic performance.
- Parental involvement and academic achievement at middle school, high school, and beyond(31 studies)
The majority of the studies investigated the link between parental involvement and student achievement in math and literacy. Most reported small to medium positive effect sizes associated with parental involvement and academic achievement.
Parental expectations were generally reported to have a positive correlation with academic achievement, or higher GPA. Valuing academic achievement and then reinforcing it produced significant positive outcomes in mathematics among high school students. Parent-child discussions about school activities and educational planning produced positive outcomes and reduced truancy. Parental control and interference resulted in negative academic achievement. Parents attending school events, meeting with teachers, and/or volunteering at school produced no improvement in academic performance.
Summary
The strongest associations with improved student performance across all grades were parental expectations and aspirations. The review also concluded that parental involvement and academic achievement do not diminish as children grow into young adulthood. What does change is how parents engage with their child over time; direct involvement in learning diminishes, but the value of fostering conditions for academic success increases. Parents seem to affect their children’s academic outcomes by setting high academic expectations and by creating, in ways not considered intrusive or controlling, a comfortable space for the children to develop their own academic motivations. The review also found that the benefits of school-based involvement by parents are not strong or produce mixed results.
Citation:Boonk, L., Gijselaers, H. J., Ritzen, H., & Brand-Gruwel, S. (2018). A review of the relationship between parental involvement indicators and academic achievement. Educational Research Review, 24, 10–30.
Link:
https://library.parenthelp.eu/wp-content/uploads/2019/01/35-A-review-of-the-relationship-between-parental-involvement-indicators-and-academic-achievement..pdf