Do Pay-for-Grades Programs Encourage Student Cheating? Evidence from a randomized experiment. Pay-for-grades programs are designed to increase student academic performance. One of the claims of those opposing such incentive systems is monetary incentives may lead to academic cheating. This randomized controlled study of 11 Chinese primary schools examines the effects of pay-for-grades programs on academic fraud. The study found widespread cheating behavior for students regardless of being in the control or experimental group, but no overall increase in the level of cheating for students in the pay-for-grades program. The authors conclude that educators need to be on the lookout for academic dishonesty, especially on standardized tests, while using moderate incentives to encourage student learning did not lead to increased levels of gaming the system.
Citation: Li, T., & Zhou, Y. (2019). Do Pay-for-Grades Programs Encourage Student Academic Cheating? Evidence from a Randomized Experiment. Frontiers of Education in China, 14(1), 117-137.
Research on informal teacher evaluation reveals the predominant evaluation method is the walk-though, which ranges from a brief 2- to 3-minute snapshot to longer observation. Studies support the important role principals play in instructional leadership but also suggest that principals are not good at identifying which teachers are the best instructors. Research finds that principals overwhelmingly understand the need to sample teacher performance but that they are rarely trained in how to accomplish this.
Citation: Cleaver, S., Detrich, R., & States, J. (2019). Informal Teacher Evaluation. Oakland, CA: The Wing Institute. Retrieved from https://www.winginstitute.org/staff-informal.
The Feasibility of Collecting School-Level Finance Data: An Evaluation of Data from the School-Level Finance Survey (SLFS) School Year 2014–15. Few things are more complicated nor critical than collecting accurate and meaningful data on school finances at the individual school level. It is complicated because of the sheer size of the education system, diversity of spending categories, differing state laws and regulations governing finances, and accounting systems not designed for this task. It is critical because the education system puts high value on equitable and adequate funding for all students. Tracking spending at the individual school level is also a requirement of the recently enacted Every Student Succeeds Act.
This research and development report field-tested a new model for collection of finance data at the school level—the School- Level Finance Survey (SLFS). The pilot SLFS, collected for fiscal year (FY) 14 (school year 2013–14) and FY 15 (school year 2014–15), was designed to evaluate whether the survey is a viable, efficient, and cost-effective method to gather comparable school-level finance data. The results suggest that, regardless of the inherent challenges, it is highly feasible to collect and report on school-level finance data with acceptable accuracy. It also projects improved response rates and the increased availability of complete, accurate, and comparable finance data at the school level as the number of states participating in the SLFS increases and the collection continues to expand.
Citation: Cornman, S.Q., Reynolds, D., Zhou, L., Ampadu, O., D’Antonio, L., Gromos, D., Howell, M., and Wheeler, S. (2019). The Feasibility of Collecting School-Level Finance Data: An Evaluation of Data From the School- Level Finance Survey (SLFS) School Year 2014–15 (NCES 2019-305). U.S. Department of Education. Washington, DC: National Center for Education Statistics.
Characteristics of Public and Private Elementary and Secondary School Principals in the United States: Results From the 2017–18 National Teacher and Principal Survey First Look: The National Teacher and Principal Survey (NTPS) collects data from public and private K-12 schools, principals, and teachers across the United States. Its data provides critical data on core topics such as school characteristics and services, principal and teacher demographics, and teacher preparation. The most recent 2017-18 report examined public (traditional), charter, and private school principals in terms of: race/ethnicity, age, highest college degree, salary, years experience (as a principal and at their current school), level of influence on decision-making, and experience with evaluations. A few of the more notable points include:
• Twenty-seven percent of school principals are 55 or older. This represents a significant number of principals who likely to retire in five years.
• The average salary for school principals is $ 92,900.
• Over ninety percent (91.7%) of school principals have a Master’s Degree or higher.
• Almost half (44.3%) of school principals have less than three years experience in their current schools.
• Seventy percent of school principals received evaluations in the selected year (79% in traditional public schools, 69% in charter schools, and 51% in private schools).
Citation: Taie, S., and Goldring, R. (2019). Characteristics of Public and Private Elementary and Secondary School Principals in the United States: Results From the 2017–18 National Teacher and Principal Survey First Look (NCES 2019- 141). U.S. Department of Education. Washington, DC: National Center for Education Statistics.
Characteristics of Public and Private Elementary and Secondary Schools in the United States: Results From the 2017–18 National Teacher and Principal Survey First Look. The National Teacher and Principal Survey (NTPS) collects data from public and private K-12 schools, principals, and teachers across the United States. Its data provides critical data on core topics such as school characteristics and services, principal and teacher demographics, and teacher preparation. The most recent 2017-18 report examined public (traditional), charter, and private schools in terms of their participation in the federal free or reduced-price lunch programs (FRLP), special education, English-language learners (ELLs) or limited-English proficient (LEP), extended school days, school start times, special emphasis schools, and minutes of instruction. One of the takeaways from the data is that public (traditional) and charter schools have almost identical statistics in these categories. Included in this data are the following:
Approximately 12% of all K-12 students have IEPs or formally identified disabilities: public (traditional) 13% schools, charter schools 11%, and private schools 7.5%. Ten percent of all K-12 students required ELL/LEP services: public (traditional) 10.6% schools, charter schools 10.2%, and private schools 2.6%.
The majority of public schools (96.6% of traditional public schools and 83.6% of charter schools) participated in the FLRP, with over half of all students receiving these services (55% of total students in each). Private schools were much less likely to participate, with only 18.8% of private schools and 8.7% of the served population receiving FRLP.
Citation: Taie, S., and Goldring, R. (2019). Characteristics of Public and Private Elementary and Secondary Schools in the United States: Results From the 2017–18 National Teacher and Principal Survey First Look (NCES 2019-140). U.S. Department of Education. Washington, DC: National Center for Education Statistics.
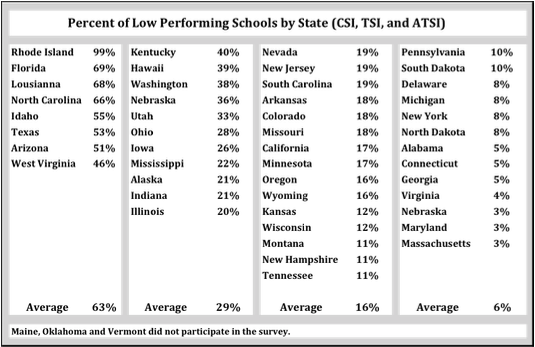
The Number of Low-Performing Schools by State in Three Categories (CSI, TSI, and ATSI), School Year 2018-19. Every Student Succeeds Act (ESSA) gives individual states significant flexibility as to how they identify “low performing schools”. This decision is extremely important as low performing school triggers mandates for states and districts to invest resources to improve them. The more schools identified, the bigger the responsibilities. ESSA identifies three categories of low-performing schools. Going from most intensive to least they include: Comprehensive Support and Improvement (CSI) schools, Targeted Support and Improvement (TSI) schools, and Additional Targeted Support and Improvement (ATSI) schools.
Ideally, each state would have consistent standards for identifying schools that are low performing. To date, there is no formal system in place to monitor these new standards. This report, completed by the Center on Education Policy, attempts to provide an initial snapshot of the number and percentages of schools each state has identified low performing. It has limitations in that states are in the early stages of implementation and calibration, states offered various degrees of cooperation, and some states had yet to complete implementation. Still, it does provide an early look at a very diverse set of guidelines.
The following chart captures their results.
Center on Education Policy (2019)
The data show a wide range of results in terms of the percentage of schools identified as low performing. The overall range is 3% to 99%, with individual states spread out fairly evenly in between. Eight states identified over 40% of their public schools as low performing, eleven states 20%–40%, fifteen states 11%–19%, and thirteen states 3%–10%. Even with the limitations of the data listed above, this data suggests inconsistent standards across states.
Citation: Stark Renter, D., Tanner, K., Braun, M. (2019). The Number of Low-Performing Schools by State in Three Categories (CSI, TSI, and ATSI), School Year 2018-19. A Report of the Center on Education Policy
An Investigation of Concurrent Validity of Fidelity of Implementation Measures at Initial Years of Implementation. Much of the effectiveness of newly introduced educational practices is lost within 18 months after introducing the method in the classroom. Understanding why practices with solid research fail is important to improving teacher effectiveness and for improving student performance. Research suggests practices implemented incorrectly are less likely to produce the desired outcomes. Research also finds that treatment fidelity (implementing practices as designed) begins to decline shortly after the new skill has been learned. This paper examines fidelity self-assessment and team-based fidelity measures in the first 4 years of implementation of School-Wide Positive Behavioral Interventions and Supports (SWPBIS). Results show strong positive correlations between fidelity self-assessments and a team-based measure of fidelity at each year of implementation.
Citation: Khoury, C. R., McIntosh, K., & Hoselton, R. (2019). An Investigation of Concurrent Validity of Fidelity of Implementation Measures at Initial Years of Implementation. Remedial and Special Education, 40(1), 25-31.
Active Student Responding (ASR) is a powerful set of low cost strategies teachers can use to improve student achievement. ASR occurs when a student makes a response by answering questions or responding in a variety of ways that communicates the student’s understanding of the content being taught during the lesson. The more opportunities the student has to respond, the increased likelihood the student is learning. Increasing active responses allows teachers to rapidly assess performance. As opportunities to respond increase so does opportunities for praise and corrective feedback that results in accelerated learning. Attending and being on-task are insufficient ways for teachers to know if learning is occurring. For a teacher to know if a student is actually learning a written, action, or oral response is required. The more opportunities to respond the more quickly students master lessons. ASR strategies are designed to engage all students regardless of class size and ASR avoids the common problem of having only high achievers answer questions while low achievers remain silent, thus escaping detection. Examples of ASR strategies include; guided notes, response slates, response cards, and choral responding.
Citation: States, J., Detrich, R. & Keyworth, R. (2019). Active Student Responding (ASR) Overview.Oakland, CA: The Wing Institute. https://www.winginstitute.org/instructional-delivery-student-respond
The Link Between School Attendance and Good Health. The American Academy of Pediatrics just released a policy statement regarding the negative impact that chronic student absenteeism has on children’s health. They cite numerous ways the two are linked. First, evidence clearly documents that chronic absenteeism puts children at a much higher risk of dropping out of school and not graduating. There is a significant amount of research associating poor school performance (resulting in lower education attainment) and poor adult health outcomes, including increased mortality risk and lower life expectancy. The act of missing school itself is also linked to increased risk behaviors, including alcohol consumption, drug use, smoking and risky sexual behavior. Also, children with chronic absenteeism are 3.5 times more likely to be arrested or referred to the juvenile justice system. The policy statement finishes with a discussion of roles the medical community can play working with schools and families to help address this problem. It reviews the evidence regarding possible physical and mental health interventions, including: infection prevention programs, school nurses, school-based health centers, mental health care, health awareness school policies and programs, parent interventions, and coordinated school health models.
Citation: Allison, M. A., & Attisha, E. (2019). The Link Between School Attendance and Good Health. Pediatrics, e20183648.
Digest of Education Statistics 2017: The Digest of Education Statistics 2017was just released by The Institute for Education Sciences (IES) National Center for Education Statistics (NCES). This annual publication is thedefinitive compendium of data on virtually every aspects of education from pre-kindergarten through graduate school. Its chapters include: All Levels of Education, Elementary and Secondary Education, Postsecondary Education, Federal Funds for Education and Related Activities, Outcomes of Education, International Comparisons of Education, and Libraries and Use of Technology. It draws from a wide range of government and private sources and applies rigorous review to everything published. It has been published annually since 1962, providing over 50 years of data with which to benchmark education performance at the system level in this country.
Citation: Snyder, T.D., de Brey, C., and Dillow, S.A. (2019). Digest of Education Statistics 2017 (NCES 2018-070). National Center for Education Statistics, Institute of Education Sciences, U.S. Department of Education. Washington, DC.