Categories for Monitoring
January 31, 2019
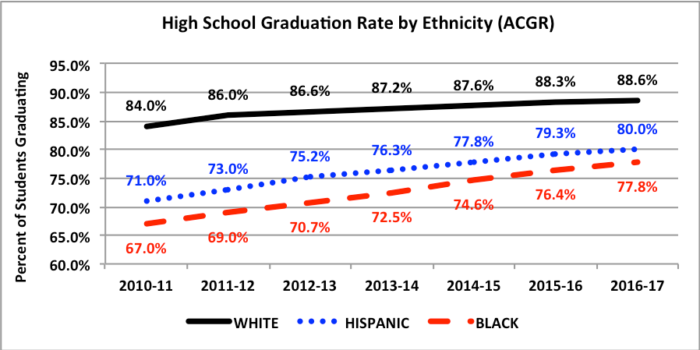
Digest of Education Statistics 2017. The most recent high school graduation rate data were just released for the 2016-17 school year. The following graph shows consistent improvement in this critical student and school performance metric. Student graduation increased by 12 percentage points during the fifteen years from 2002 and 2017. While there is still much work to be done to identify and implement graduation standards that translate into meaningful and life long benefits, this type of consistent performance improvement should be acknowledged.
•AFGR: The Average Freshman Graduation Rate (AFGR) was used by the U.S. Department of Education (DOE) from 2002 through 2013.
•ACGR: The Four-Year Adjusted Cohort Graduation Rate (ACGR) was established by DOE in 2008, establishing a uniform and more accurate measure for calculating the rate at which students graduated from high school.
Both models co-existed for threes years and had comparable graduate rate data during that time.
A second area of the report disaggregates graduation rate data by students from different ethnic backgrounds. There remains an unacceptable graduation rate gap between White and Black students, and White and Hispanic students. The resulting graduation rate for Black students (77.8%) and Hispanic students (80.0%) are failures of the system. While progress will always be too slow in this area, the data do show steady progress in closing the gap over the last six years. The graduation gap between White and Black students decreased by 6.2 percentage points (from 17% in 2010-11 to 10.8% in 2016-17). The graduation gap between White and Hispanic students decreased by 4.4 percentage points (from 13% in 2010-11 to 8.6% in 2016-17).
A third area of disaggregated data was that of graduation rates by individual states. The variation between states continues to be extreme with the top ten states averaging a 89.7% graduation rate and the bottom ten states averaging 77.4%.
Improving graduation rates continue to be a clear focus of the education system, and while there is a long way to go, it is one of the few areas where progress is being made.
Citation: Snyder, T.D., de Brey, C., and Dillow, S.A. (2019). Digest of Education Statistics 2017 (NCES 2018-070). National Center for Education Statistics, Institute of Education Sciences, U.S. Department of Education. Washington, DC.
Link: https://files.eric.ed.gov/fulltext/ED592104.pdf
January 22, 2019
When Evidence-based Literacy Programs Fail. This study examines the implementation of Leveled Literacy Intervention (LLI) for struggling readers that had been proven to work in early grades. Disappointingly, the results showed after an average of 19 weeks of instruction the intervention had no impact on students’ reading comprehension and a negative impact on their mastery of ELA/literacy standards. The LLI impact on Smarter Balanced ELA/literacy scores was roughly equivalent to students losing more than five months of learning, based on the typical annual growth of students in grades 6-8. When the results were deconstructed, it was found that the failure to overcome obstacles to effective implementation played a significant role in the failure of the program to produce the anticipated results. The findings highlight the importance of considering context and implementation, in addition to evidence of effectiveness, when choosing an intervention program. Not only do schools need to adopt programs supported by evidence, but equally educators need to implement them consistently and effectively if students are to truly benefit from an intervention.
Citation: Gonzalez, N. (2018). When evidence-based literacy programs fail. Phi Delta Kappan, 100(4), 54–58. https://doi.org/10.1177/0031721718815675
Link: https://journals.sagepub.com/doi/full/10.1177/0031721718815675#articleCitationDownloadContainer
December 21, 2018
“Trends in High School Dropout and Completion Rates in the United States: 2018”. Dropping out of high school has significant negative impacts on students. Statistically, they will have lower earnings than high school graduates, are more likely to be unemployed, have poorer health, and have a higher rate of incarceration. This report provides a detailed analysis of long-term dropout and completion trends and student characteristics of high school dropouts and completers. The first measure examined was the “event dropout rate” which is the percent of students who drop out in grades 10-12 without a high school diploma or alternative credential. The event dropout rate for SY 2015-16 was 4.8%, which translated into 532,000 students.
The 40 year trend show an alarming lack of progress. While 2015-16 was lower than in 1976 (5.8%), it reflects a worsening over the last ten years (increasing from 3.8% to 4.8%). Of all of the student demographic data, the clearest impact was that of family income. Students from the lowest income families had a 7.2% dropout rate compared to 3.9% for highest income families. The “adjusted cohort graduation rate” for 2015-16 was 84% which showed steady improvement over the past five years. The main problem is the significant differences in graduate rates across race, economic status, states, and disabilities. For example, graduation rates for white students ranged from 76% in New Mexico to 94% in New Jersey; black students from 57% in Nevada to 88% in West Virginia; Hispanic students from 65% in Minnesota to 89 % in Vermont.
Citation:
McFarland, J., Cui, J., Rathbun, A., and Holmes, J. (2018). Trends in High School Dropout and Completion Rates in the United States: 2018 (NCES 2019-117). U.S. Department of Education. Washington, DC: National Center for Education Statistics. Retrieved December 14, 2018 from http://nces.ed.gov/pubsearch.
Link: https://nces.ed.gov/pubs2019/2019117.pdf
October 29, 2018
Grade Inflation in High Schools (2005–2016)
Student grades have been one of the longest standing tools for measuring student performance and there is an inherent assumption by educators and parents that they are accurate reflections of how well their children are doing. This study examines that assumption, asking the question: how well do student grades correlate with test scores, school demographics, student performance on college entrance exams, and the historical difficulty for getting A’s (is it easier or harder to get A’s). The study found that students who scored higher on end-of-course (EOC) examinations also had higher grades. However having high grades did not correlate with doing well on the examination. For example only 21% of “A” students and 3% of “B” students passed the highest standard on the EOC exam. Over one third of students receiving B’s failed to score proficient on the exam. The overall conclusions were: (1) having good grades is no guarantee that a student has learned the expected knowledge from a course, (2) in the case of math (the curriculum area studied), end of course scores are much more predictive of ACT scores than course grades, and (3) grade point averages (GPA’s) have grown steadily from 2005 to 2016, and that the most significant growth has been in more affluent schools.
Citation: Gershenson, S. (2018). Grade Inflation in High Schools (2005–2016).
Link: http://edex.s3-us-west-2.amazonaws.com/publication/pdfs/(2018.09.19)%20Grade%20Inflation%20in%20High%20Schools%20(2005-2016).pdf
July 26, 2018
Teacher Evaluation Overview (Wing Institute Original Paper)
Teachers contribute to student achievement. As a practice, teacher evaluation has developed over time. Today, the focus of teacher evaluation is to determine the impact of teaching on student outcomes and for use as professional development. Research on teacher evaluation has produced mixed results. This overview provides information about teacher evaluation as it relates to collecting information about teacher practice and using it to improve student outcomes. The history of teacher evaluation and current research findings and implications are included. (Read More)
Citation: Cleaver, S., Detrich, R. & States, J. (2018). Overview of Teacher Evaluation. Oakland, CA: The Wing Institute. https://www.winginstitute.org/assessment-summative.
Link: https://www.winginstitute.org/policy-initiatives-teacher-evaluation
July 2, 2018
Preparing for Life after High School: The Characteristics and Experiences of Youth in Special Education. Findings from the National Longitudinal Transition Study 2012. Volume 2: Comparisons across Disability Groups. Full Report
News Summary:The United States has committed to improving the lives of students with disabilities for over 40 years. Since the advent of Federal Law PL 94-142 in 1975 that mandated a free and appropriate education for all students regardless of ability and six reauthorizations of legislation, the federal government has emphasized the need to prepare students with disabilities for post-secondary education, careers, and independent living. The federal investment in funding special education services exceeds $15 Billion annually. It is reasonable to ask, are student with disabilities substantially benefiting from these efforts? The National Longitudinal Transition Study (NLTS) provides the most recent data on youth with disabilities and efforts to address their needs. The study used surveys in 2012 and 2013 on a nationally representative set of nearly 13,000 students. The student included were mostly those with an individualized education program (IEP) and expected to receive special education services. The data reveal participation in key transition activities by youth with an IEP and their parents have declined, although they are just as likely to have gone to an IEP meeting. The findings from this report suggest a closer examination of current practices is warranted with a focus on achieving the stated outcomes the laws were designed to remedy.
Citation: Lipscomb, S., Hamison, J., Liu Albert, Y., Burghardt, J., Johnson, D. R., & Thurlow, M. (2018). Preparing for Life after High School: The Characteristics and Experiences of Youth in Special Education. Findings from the National Longitudinal Transition Study 2012. Volume 2: Comparisons across Disability Groups. Full Report. NCEE 2017-4018. National Center for Education Evaluation and Regional Assistance.
Link: https://files.eric.ed.gov/fulltext/ED580934.pdf
June 27, 2018
Four Domains for Rapid School Improvement: An Implementation Framework
The National Implementation Research Network (NIRN) and the National Center for School Turnaround published the “Four Domains for Rapid School Improvement: An Implementation Framework” as a companion to the Center for School Turnaround’s publication of “The Four Domains for Rapid School Improvement: A Systems Framework“. This paper describes “how” to effectively implement lasting school improvement initiatives that maximize leadership, develop talent, amplify instructional transformation, and shift the culture.
Citation:Jackson, K., R., Fixsen, D., and Ward, C. (2018). Four Domains for Rapid School Improvement: An Implementation Framework. The Center on School Turnaround.
Link: https://files.eric.ed.gov/fulltext/ED583980.pdf
January 22, 2018
The impact of tier 1 reading instruction on reading outcomes for students in Grades 4–12: A meta-analysis
This meta-analysis examines the impact of 1st tier reading instruction on reading outcomes for students in grades 4-12 in an Multi-tiered System of Support (MTSS) service delivery model. 37 studies met criteria for inclusion in the meta-analysis. The study finds small, but positive effects for 1st tier reading instruction on comprehension, vocabulary, and indicates minimum evidence for struggling readers maintaining or improving reading comprehension over struggling students receiving typical instruction. Hedges’s g was used calculating effect sizes. Because of the limited number of studies examining phonics/word recognition and fluency instruction, it was not possible these critical instruction areas in this meta-analysis.
Citation: Swanson, E., Stevens, E. A., Scammacca, N. K., Capin, P., Stewart, A. A., & Austin, C. R. (2017). The impact of tier 1 reading instruction on reading outcomes for students in Grades 4–12: A meta-analysis. Reading and Writing, 30(8), 1639-1665.
Link: https://link.springer.com/article/10.1007/s11145-017-9743-3
December 4, 2017
Framework for Improving Education Outcomes
Multitiered system of support (MTSS) is a framework for organizing service delivery. At the core of MTSS is the adoption and implementation of a continuum of evidence-based interventions that result in improved academic and behavioral outcomes for all students. MTSS is a data-based decision making approach based on the frequent screening of progress for all students and intervention for students who are not making adequate progress.
Citation: States, J., Detrich, R., and Keyworth, R. (2017). Multitiered System of Support Overview. Oakland, Ca. The Wing Institute.
Link: https://winginstitute.org/school-programs-multi-tiered-systems
September 26, 2017
Preventing Dropout in Secondary Schools
This What Works Clearinghouse practice guide provides educators and administrators with four evidence-based recommendations for reducing dropout rates in middle and high schools. The guide offers specific, strategies; examples of how to implement the practices; advice on how to overcome obstacles; and a summary of the supporting evidence.
Citation: Rumberger, R. W., et al. (2017). Educator’s Practice Guide: Preventing Dropout in Secondary School. IES National Center for Education and Evaluation and Regional Assistance.
Link: https://ies.ed.gov/ncee/wwc/Docs/PracticeGuide/wwc_dropout_092617.pdf