Categories for Societal Outcomes
January 15, 2020
Overview of Value-Added Research in Education: Reliability, Validity, Efficacy, and Usefulness. Value-added modeling (VAM) is a statistical approach that provides quantitative performance measures for monitoring and evaluating schools and other aspects of the education system. VAM comprises a collection of complex statistical techniques that use standardized test scores to estimate the effects of individual schools or teachers on student performance. Although the VAM approach holds promise, serious technical issues have been raised regarding VAM as a high-stakes instrument in accountability initiatives. The key question remains: Can VAM scores of standardized test scores serve as a proxy for measuring teaching quality? To date, research on the efficacy of VAM is mixed. There is a body of research that supports VAM, but there is also a body of studies suggesting that model estimates are unstable over time and subject to bias and imprecision. A second issue with VAM is the sole use of standardized tests as a measure of student performance. Despite these valid concerns, VAM has been shown to be valuable in performance improvement efforts when used cautiously in combination with other measures of student performance such as end-of-course tests, final grades, and structured classroom observations.
Citation: Cleaver, S., Detrich, R. & States, J. (2020). Overview of Value-Added Research in Education: Reliability, Validity, Efficacy, and Usefulness. Oakland, CA: The Wing Institute. https://www.winginstitute.org/staff-value-added.
Link: https://www.winginstitute.org/staff-value-added
January 15, 2020
Trend in High School Dropout and Completion Rates in the United States: 2018. This report provides the most recent year of data available for each dropout and completion rate, summarizes long-term trends, and examines the characteristics of high school dropouts and completers. Five rates are presented to provide a broad perspective on high school dropouts and completers in the United States: the event dropout rate, the status dropout rate, the status completion rate, the adjusted cohort graduation rate, and the averaged freshman graduation rate. The report also provides information about individuals who completed an alternative high school credential.
Citation: McFarland, J., Cui, J., Rathbun, A., and Holmes, J. (2019). Trend in High School Dropout and Completion Rates in the United States:2018. National Center for Education Statistics. NCES 2019-117 US Department of Education.
Link: https://nces.ed.gov/pubs2019/2019117.pdf
January 15, 2020
What to Make of Declining Enrollment in Teacher Preparation Programs. This policy report provides a look at the decline in the enrollment of American teacher preparation programs, along with potential consequences for schools and the students they serve. The analysis offers education policymakers with insight into the complex issues involved in maintaining sufficient numbers of qualified teachers. While enrollment in teacher preparation programs has declined by more than one-third since 2010, the analysis described in this report paints a more complex and nuanced picture than the national numbers portray. The study finds significant variations among states in the change in enrollment in teacher preparation programs.
Citation: Partelow, L. (2019). What to Make of Declining Enrollment in Teacher Preparation Programs. Center for American Progress. https://www.americanprogress.org/issues/education-k-12/reports/2019/12/03/477311/make-declining-enrollment-teacher-preparation-programs/
Link: https://www.americanprogress.org/issues/education-k-12/reports/2019/12/03/477311/make-declining-enrollment-teacher-preparation-programs/
January 7, 2020
School Principal Competencies. Research has consistently shown that principals play a critical role in determining the quality of teaching, and in turn, student learning and achievement. Recent meta-analytic reviews suggest that effective principals are highly competent in the following areas: 1) establishing and conveying the school’s vision, goals and expectations by modeling aspirational practices and promoting data use for continuous improvement; 2) building teachers’ professional capacity by providing targeted and job-embedded professional development, protecting instructional time, and selecting educators who are the “right fit” for the school; 3) creating a supportive organization for learning by sharing and distributing leadership, understanding and building on diversity, and strategically acquiring and allocating resources; 4) facilitating a high-quality student learning experience by developing and monitoring curriculum, instruction, and assessment, and creating learning environments that are personalized, safe, and orderly; and 5) connecting with external partners who can support fulfillment of school goals, and building productive and collaborative relationships with families. While these principal competencies are relevant for a range of school contexts, leaders operating in varying school environments (e.g., high/low poverty, urban/rural) must ultimately determine how best to enact them to optimize teaching and learning.
Citation: Donley, J., Detrich, R., States, J., & Keyworth, (2020). Principal Competencies. Oakland, CA: The Wing Institute. https://www.winginstitute.org/principal-competencies-research
Link: https://www.winginstitute.org/principal-competencies-research
December 17, 2019
Practice Outpacing Policy? Credit Recovery in American School Districts. Traditionally, students who failed classes could get credit by taking the class over during summer school. In a relatively brief period of time, most high schools have a undergone a complete and rapid transformation in this area, shifting to “credit recovery” programs to help at-risk students earn credits towards graduation for classes they have failed. These programs typically offer online alternatives to students rather than having them retake the failed class. In the 2015-16 school year approximately three out of four high schools offered credit recovery programs with about 6% of all students participating. This growth in credit recovery programs, rapid expansion of new online models, and numerous cases of misuse to inflate graduation rates highlight the need for research into the implementation and effectiveness of this intervention.
This study examined the policies and practices of a representative sample of high schools to identify how they structure their credit recovery programs. It found: Over 95% of the credit recovery program had online components (58% online with some in-person instruction, 37% were exclusively online). Seventy-eight percent used just one online credit recovery provider to manage their system. Eighty-seven percent of districts offer credit recovery programs year-round. Forty percent of the districts limited credit recovery to courses
Traditionally, students who failed classes could get credit by taking the course over during summer school. In a relatively brief time, most high schools have undergone a complete and rapid transformation in this area, shifting to “credit recovery” programs to help at-risk students earn credits towards graduation for classes they have failed. These programs typically offer online alternatives to students rather than having them retake the failed class. In the 2015-16 school year, approximately three out of four high schools offered credit recovery programs with, about 6% of all students participating. This growth in credit recovery programs, a rapid expansion of new online models, and numerous cases of misuse to inflate graduation rates highlight the need for research into the implementation and effectiveness of this intervention
This study examined the policies and practices of a representative sample of high schools to identify how they structure their credit recovery programs. It found: Over 95% of the credit recovery program had online components (58% online with some in-person instruction, 37% were exclusively online). Seventy-eight percent used just one online credit recovery provider to manage their system. Eighty-seven percent of districts offer credit recovery programs year-round. Forty percent of the districts limited credit recovery to courses required for graduation. Only 16% limited the option to twelfth graders, allowing students from all high school grades to avail themselves of the option. The study concluded that “many districts’ policies allow lots of flexibility for student access and assessment with relatively little constraint. Taken individually, these policies could be justifiable but taken together, and they leave credit recovery programs ripe for abuse.”
Citation: Malkus, N. (2019). Practice Outpacing Policy? Credit Recovery in American School Districts. American Enterprise Institute.
Web Address: https://www.aei.org/wp-content/uploads/2019/11/Practice-Outpacing-Policy.pdf
December 16, 2019
On the Reality of Dyslexia. This paper assesses research on the topic of dyslexia. Willingham’s piece is in response to comments made by literacy researcher, Dick Allington, in which he questions the legitimacy of the label, dyslexia. Answering this question is more than an academic exercise as having a clearer understanding of dyslexia is crucial if educators are to understand why 10% of students struggle to master reading, the skill essential to success in academic learning. Willingham highlights the etiology of the disorder, and he concludes that the ability to read is the product of the home environment, instruction at school, and genetics within the child. Dyslexia is a problem in the child’s ability to successfully master the skills of reading and is closely related to fluency in language. Dyslexia is not like measles in which you are ill, or you aren’t. Dyslexia is more like high blood pressure where individuals fall on a bell curve. Falling somewhere on the bell curve is supported by the hypothesis that the disorder is the complex interaction between multiple causes. Although it does not have a single source, dyslexia is successfully remediated through evidence-based language and reading instruction.
Citation: Willingham, D. (2019). On the Reality of Dyslexia. Charlottesville, VA.http://www.danielwillingham.com/daniel-willingham-science-and-education-blog/on-the-reality-of-dyslexia?utm_source=feedburner&utm_medium=email&utm_campaign=Feed%3A+nbspDanielWillingham-DanielWillinghamScienceAndEducationBlog+%28Daniel+Willingham%27s+Science+and+Education+Blog%29.
Link: On the Reality of Dyslexia
December 16, 2019
PISA 2018 Results (Volume I): What Students Know and Can Do. Benchmark Indicators are critical tools to help education stakeholders track their education system’s performance over time, in comparison to other similar level education systems (state, national, international), and by student groups (ethnicity, disabilities, socioeconomic status, etc.). One of the most respected tools for benchmarking system performance is the Program for International Student Assessment (PISA), which tests 15-year-old-students across nearly 80 countries and educational systems in reading, mathematics, and science. The results from the most recent testing (2018) were just released. The report itself has an enormous amount of data. A summary of key findings follows.
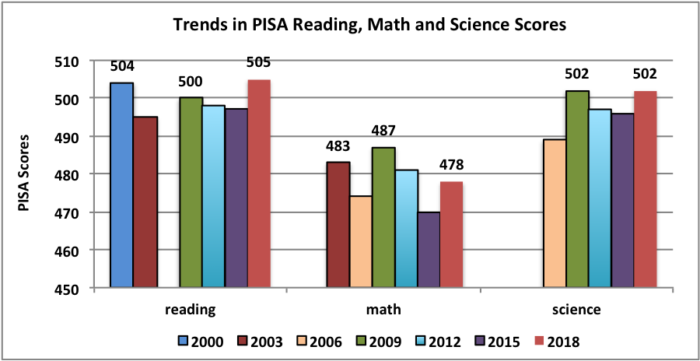
Performance Over Time
U.S. test performance, despite small fluctuations, has been virtually flat over the past twelve to eighteen years (depending on the subject area). The reading performance score was 504 in 2000 and 505 in 2018. Math performance got worse, dropping from 483 in 2003 to 478 in 2018. And science performance has remained the same over the last four testing periods, remaining at 502 between 2009 and 2018. Consistency is not inherently a bad thing depending on how well a system is performing. However, PISA data suggests that the U.S. system is significantly underperforming compared to other international systems (see following). Consistency is also a problem when one considers that unprecedented investments in school reform efforts during this time period (e.g. No Child Left Behind, School Improvement Grants, Race to the Top, and Every Student Succeeds) have failed to move the needle in any significant way.
Performance Compared to Other Countries
U.S performance in reading ranked thirteenth among participating nations in reading, thirty-eighth in math, and twelfth in science. These represent a slight improvement in rankings from the 2015 test results, but that is a reflection of several top performing nations had lower scores, not that the U.S. improved.
Performance Across Different Student Subgroups
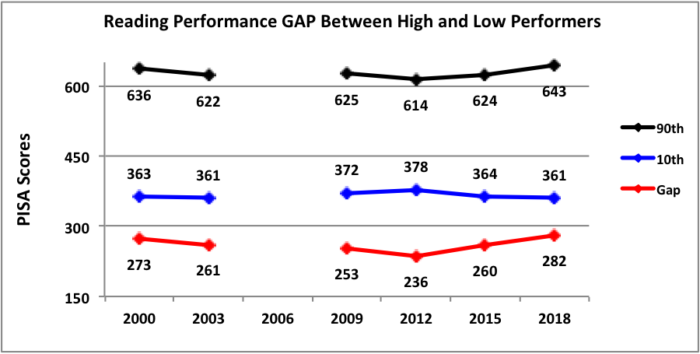
One of the biggest takeaway’s from this report is the growing inequity in performance between the high student performers and low. The following chart looks at the average scores of a gap between student scores in the highest percent of academic achievement (90%) and scores at the lowest (10%).
Reading scores of the highest performing students have increased over the lasts two tests from 614 to 643, while the scores of the lowest 10% have decreased from 378 to 361. The result is a widening gap between the top and lowest performing students. While improving the scores of the best performing students is a laudable achievement, an education system must serve all of its students in the interest of equity.
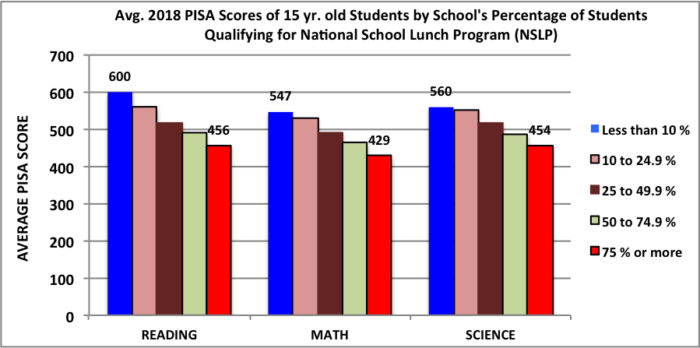
Further analysis of the data shows a correlation between student performance differences and their socioeconomic status (SES). One of the metrics used to determine SES is whether or not students qualify for the National School Lunch Program.
This data shows a direct correlation between a school’s reading scores and the SES of its student body. The more low SES students, the lower the PISA reading, math, and science scores.
It is almost impossible to document cause and effect with data at this level of analysis and control. Still, when making policy and program decisions, we must use the best available evidence. In this case, the best available evidence portrays an education system that, despite significant school improvement efforts, has shown little or no improvement over time, performs worse than a significant number of other nations’ education systems and continues to have inequitable results.
Citation. OECD (2019), PISA 2018 Results (Volume I): What Students Know and Can Do, PISA, OECD Publishing, Paris, https://doi.org/10.1787/5f07c754-en.
Web Address. https://www.oecd.org/pisa/publications/pisa-2018-results-volume-i-5f07c754-en.htm
October 15, 2019
The effect of charter schools on student achievement. Charter schools increasingly play a prominent role in educating students in the United States. Given the vast resources allocated to charter schools, it is imperative the question is asked, How effective are these schools in comparison to traditional public schools? This meta-analysis focuses on student math and reading performance. The authors found an overall effect size for elementary school reading and math of 0.02 and 0.05 and middle school math of 0.055. Effects were not statistically meaningful for middle school reading and high school math and reading. The study offers compelling evidence that charters under-perform traditional public schools in some locations, grades, and subjects, and out-perform traditional public schools in other geographical locations, grades, and subjects. The mixed results are not surprising as there is no set management model, quality of personnel, curricula, or pedagogy that distinguishes charter schools from public schools. The study did find a small positive effect size for KIPP charter schools. The absence of significant achievement gains attributed to charter schools should concern school systems considering expanding the number of charter schools as a solution to underperforming schools.
Citation: Betts, J. R., & Tang, Y. E. (2019). The effect of charter schools on student achievement. School choice at the crossroads: Research perspectives, 67-89.
Link: https://files.eric.ed.gov/fulltext/ED526353.pdf
October 14, 2019
Supporting Appropriate Student Behavior Overview. Proactive classroom management strategies promote appropriate behavior and reduce or prevent misbehavior. Reinforcement is at the core of most proactive strategies. It is defined as a consequence that follows a behavior and increases the frequency of that behavior. Contingent praise is a versatile strategy based on reinforcement. Through positive statements delivered by the teacher, contingent praise acknowledges appropriate conduct and informs students what they did well. A rule of thumb is to maintain a 4:1 ratio of positive praise to corrective statements. Teachers should avoid the trap of becoming overly critical, which can damage the student-teacher relationship and lead to increased misbehavior. Other reinforcement-based strategies that use praise as well as material reinforcers include class-wide group contingencies, point systems, and behavior contracts. Material reinforcers commonly used in schools include tangible reinforcers (stickers, toys, food), preferred activities (games, computer time), and privileges (running errands, distributing papers). Additional proactive strategies are classroom rules and procedures, a structured environment, active supervision, and effective instruction; see classroom management drivers.
Citation: Guinness, K., Detrich, R., Keyworth, R. & States, J. (2019). Overview of Supporting Appropriate Behavior. Oakland, CA: The Wing Institute. https://www.winginstitute.org/classroom-appropriate-behaviors.
Link: https://www.winginstitute.org/classroom-appropriate-behaviors.
October 7, 2019
Decades of data attest to high rates of teacher turnover. Almost half of new teachers leave the profession within 5 years. For the past 10 years, turnover has leveled off at a disconcerting 16% per year. High turnover impedes student performance and diverts resources away from efforts to improve schools. It places large numbers of inexperienced, less effective teachers in classrooms, resulting in increased recruiting, hiring, and training budgets. With effective retention, the United States could save a meaningful portion of the $2.2 billion spent annually on replacing teachers. Research shows that increases in teacher turnover consistently correspond with decreases in achievement in core academic subjects. Attrition disproportionately affects schools with the greatest needs, low-achieving and high-poverty schools. Chronic turnover also negatively impacts a school’s culture, increasing student disciplinary problems and principal turnover. It damages collegiality, adding chaos and complexity to schoolwide operations and perpetuating new cycles of turnover. Effective interventions can remediate this situation, but they require administrators’ long-term commitment to improve the learning environment and working conditions.
Citation: Donley, J., Detrich, R, Keyworth, R., & States, J. (2019). Teacher Turnover Impact. Oakland, CA: The Wing Institute. https://www.winginstitute.org/teacher-retention-turnover
Link: https://www.winginstitute.org/teacher-retention-turnover