Most Recent Test Results from Pisa On Reading, Math and Science
December 16, 2019PISA 2018 Results (Volume I): What Students Know and Can Do. Benchmark Indicators are critical tools to help education stakeholders track their education system’s performance over time, in comparison to other similar level education systems (state, national, international), and by student groups (ethnicity, disabilities, socioeconomic status, etc.). One of the most respected tools for benchmarking system performance is the Program for International Student Assessment (PISA), which tests 15-year-old-students across nearly 80 countries and educational systems in reading, mathematics, and science. The results from the most recent testing (2018) were just released. The report itself has an enormous amount of data. A summary of key findings follows.
Performance Over Time
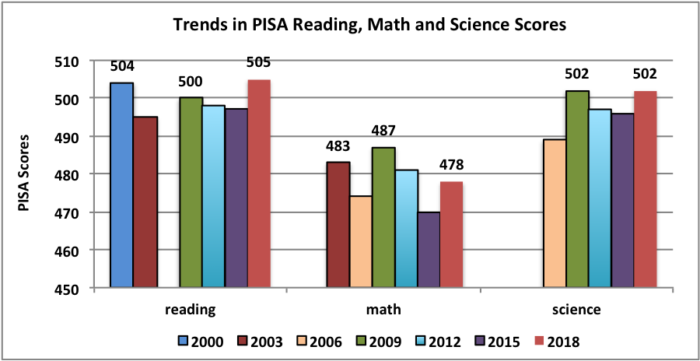
U.S. test performance, despite small fluctuations, has been virtually flat over the past twelve to eighteen years (depending on the subject area). The reading performance score was 504 in 2000 and 505 in 2018. Math performance got worse, dropping from 483 in 2003 to 478 in 2018. And science performance has remained the same over the last four testing periods, remaining at 502 between 2009 and 2018. Consistency is not inherently a bad thing depending on how well a system is performing. However, PISA data suggests that the U.S. system is significantly underperforming compared to other international systems (see following). Consistency is also a problem when one considers that unprecedented investments in school reform efforts during this time period (e.g. No Child Left Behind, School Improvement Grants, Race to the Top, and Every Student Succeeds) have failed to move the needle in any significant way.
Performance Compared to Other Countries
U.S performance in reading ranked thirteenth among participating nations in reading, thirty-eighth in math, and twelfth in science. These represent a slight improvement in rankings from the 2015 test results, but that is a reflection of several top performing nations had lower scores, not that the U.S. improved.
Performance Across Different Student Subgroups
One of the biggest takeaway’s from this report is the growing inequity in performance between the high student performers and low. The following chart looks at the average scores of a gap between student scores in the highest percent of academic achievement (90%) and scores at the lowest (10%).
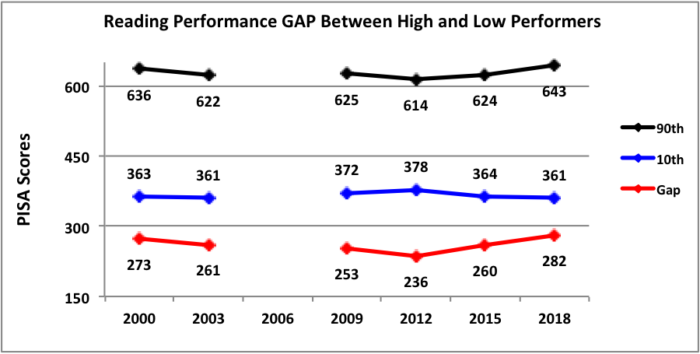
Reading scores of the highest performing students have increased over the lasts two tests from 614 to 643, while the scores of the lowest 10% have decreased from 378 to 361. The result is a widening gap between the top and lowest performing students. While improving the scores of the best performing students is a laudable achievement, an education system must serve all of its students in the interest of equity.
Further analysis of the data shows a correlation between student performance differences and their socioeconomic status (SES). One of the metrics used to determine SES is whether or not students qualify for the National School Lunch Program.
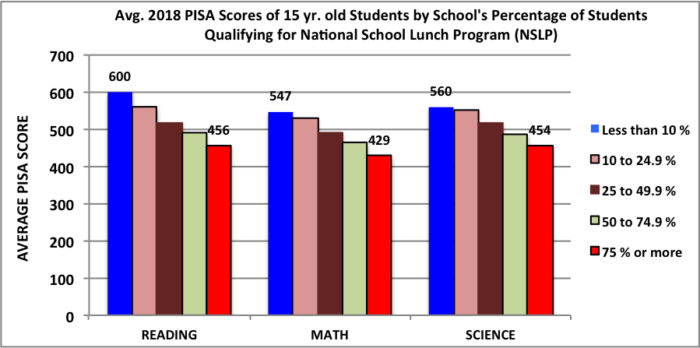
This data shows a direct correlation between a school’s reading scores and the SES of its student body. The more low SES students, the lower the PISA reading, math, and science scores.
It is almost impossible to document cause and effect with data at this level of analysis and control. Still, when making policy and program decisions, we must use the best available evidence. In this case, the best available evidence portrays an education system that, despite significant school improvement efforts, has shown little or no improvement over time, performs worse than a significant number of other nations’ education systems and continues to have inequitable results.
Citation. OECD (2019), PISA 2018 Results (Volume I): What Students Know and Can Do, PISA, OECD Publishing, Paris, https://doi.org/10.1787/5f07c754-en.
Web Address. https://www.oecd.org/pisa/publications/pisa-2018-results-volume-i-5f07c754-en.htm