Do Pay-for-Grades Programs Encourage Student Cheating? Evidence from a randomized experiment. Pay-for-grades programs are designed to increase student academic performance. One of the claims of those opposing such incentive systems is monetary incentives may lead to academic cheating. This randomized controlled study of 11 Chinese primary schools examines the effects of pay-for-grades programs on academic fraud. The study found widespread cheating behavior for students regardless of being in the control or experimental group, but no overall increase in the level of cheating for students in the pay-for-grades program. The authors conclude that educators need to be on the lookout for academic dishonesty, especially on standardized tests, while using moderate incentives to encourage student learning did not lead to increased levels of gaming the system.
Citation: Li, T., & Zhou, Y. (2019). Do Pay-for-Grades Programs Encourage Student Academic Cheating? Evidence from a Randomized Experiment. Frontiers of Education in China, 14(1), 117-137.
The Feasibility of Collecting School-Level Finance Data: An Evaluation of Data from the School-Level Finance Survey (SLFS) School Year 2014–15. Few things are more complicated nor critical than collecting accurate and meaningful data on school finances at the individual school level. It is complicated because of the sheer size of the education system, diversity of spending categories, differing state laws and regulations governing finances, and accounting systems not designed for this task. It is critical because the education system puts high value on equitable and adequate funding for all students. Tracking spending at the individual school level is also a requirement of the recently enacted Every Student Succeeds Act.
This research and development report field-tested a new model for collection of finance data at the school level—the School- Level Finance Survey (SLFS). The pilot SLFS, collected for fiscal year (FY) 14 (school year 2013–14) and FY 15 (school year 2014–15), was designed to evaluate whether the survey is a viable, efficient, and cost-effective method to gather comparable school-level finance data. The results suggest that, regardless of the inherent challenges, it is highly feasible to collect and report on school-level finance data with acceptable accuracy. It also projects improved response rates and the increased availability of complete, accurate, and comparable finance data at the school level as the number of states participating in the SLFS increases and the collection continues to expand.
Citation: Cornman, S.Q., Reynolds, D., Zhou, L., Ampadu, O., D’Antonio, L., Gromos, D., Howell, M., and Wheeler, S. (2019). The Feasibility of Collecting School-Level Finance Data: An Evaluation of Data From the School- Level Finance Survey (SLFS) School Year 2014–15 (NCES 2019-305). U.S. Department of Education. Washington, DC: National Center for Education Statistics.
Characteristics of Public and Private Elementary and Secondary School Principals in the United States: Results From the 2017–18 National Teacher and Principal Survey First Look: The National Teacher and Principal Survey (NTPS) collects data from public and private K-12 schools, principals, and teachers across the United States. Its data provides critical data on core topics such as school characteristics and services, principal and teacher demographics, and teacher preparation. The most recent 2017-18 report examined public (traditional), charter, and private school principals in terms of: race/ethnicity, age, highest college degree, salary, years experience (as a principal and at their current school), level of influence on decision-making, and experience with evaluations. A few of the more notable points include:
• Twenty-seven percent of school principals are 55 or older. This represents a significant number of principals who likely to retire in five years.
• The average salary for school principals is $ 92,900.
• Over ninety percent (91.7%) of school principals have a Master’s Degree or higher.
• Almost half (44.3%) of school principals have less than three years experience in their current schools.
• Seventy percent of school principals received evaluations in the selected year (79% in traditional public schools, 69% in charter schools, and 51% in private schools).
Citation: Taie, S., and Goldring, R. (2019). Characteristics of Public and Private Elementary and Secondary School Principals in the United States: Results From the 2017–18 National Teacher and Principal Survey First Look (NCES 2019- 141). U.S. Department of Education. Washington, DC: National Center for Education Statistics.
Matching the availability of teachers to demand constantly evolves. During recessions schools are forced to layoff teachers. As economic times improve, schools acquire resources and rehire personnel. Currently, American schools are faced with the most severe shortages in special education; science, technology, engineering, and math (STEM); and bilingual education. Shortages vary across the country and are most acute in areas with lower wages and in poor schools. Starting in the 1980’s schools began filling vacancies with under-qualified personnel hired on emergency or temporary credentials to meet needs. A 35% drop in pre-service enrollment and high teacher attrition currently impact the supply. Candidates and veteran teachers are influenced to leave teaching due to low compensation, stressful working conditions, and a perceived decline in respect. The demand side is influenced primarily by fluctuations in population, finances, and education policy. Matching supply to demand is a challenge but can be accomplished through better planning, procuring less volatile funding sources, and improving working conditions through improved pay and effective training.
Citation: Donley, J., Detrich, R. Keyworth, R., & States, J., (2019). Teacher Retention Analysis Overview. Oakland, CA: The Wing Institute. https://www.winginstitute.org/teacher-retention-turnover-analysis.
Characteristics of Public and Private Elementary and Secondary Schools in the United States: Results From the 2017–18 National Teacher and Principal Survey First Look. The National Teacher and Principal Survey (NTPS) collects data from public and private K-12 schools, principals, and teachers across the United States. Its data provides critical data on core topics such as school characteristics and services, principal and teacher demographics, and teacher preparation. The most recent 2017-18 report examined public (traditional), charter, and private schools in terms of their participation in the federal free or reduced-price lunch programs (FRLP), special education, English-language learners (ELLs) or limited-English proficient (LEP), extended school days, school start times, special emphasis schools, and minutes of instruction. One of the takeaways from the data is that public (traditional) and charter schools have almost identical statistics in these categories. Included in this data are the following:
Approximately 12% of all K-12 students have IEPs or formally identified disabilities: public (traditional) 13% schools, charter schools 11%, and private schools 7.5%. Ten percent of all K-12 students required ELL/LEP services: public (traditional) 10.6% schools, charter schools 10.2%, and private schools 2.6%.
The majority of public schools (96.6% of traditional public schools and 83.6% of charter schools) participated in the FLRP, with over half of all students receiving these services (55% of total students in each). Private schools were much less likely to participate, with only 18.8% of private schools and 8.7% of the served population receiving FRLP.
Citation: Taie, S., and Goldring, R. (2019). Characteristics of Public and Private Elementary and Secondary Schools in the United States: Results From the 2017–18 National Teacher and Principal Survey First Look (NCES 2019-140). U.S. Department of Education. Washington, DC: National Center for Education Statistics.
Teacher turnover has been a persistent challenge; while the national rate has hovered at 16% in recent decades, more teachers are leaving the profession, contributing to teacher shortages in hard-to-staff subjects and schools. Higher attrition rates coupled with disproportionate teacher movement away from schools in economically disadvantaged communities has resulted in inequitable distributions of high-quality teachers across schools. Teacher turnover is quite costly, and primarily has negative consequences for school operations, staff collegiality, and student learning. Turnover rates are highest among minority teachers working in high-need schools, beginning teachers, and those who are alternatively certified; higher rates are also found for those teaching math, science, and English as a foreign language, and for special education teachers. Teachers are less likely to be retained in schools with poor working conditions, particularly those led by principals perceived to be less effective, and in schools where they are paid less. Teacher retention may be improved with combinations of targeted financial incentives and improved working conditions (e.g., better principal preparation), and through better supports for early career teachers through effective induction and mentoring programs. Linking financial incentives with enhanced leadership opportunities and career paths also offer potential for retaining effective teachers in classrooms where they are most needed.
Answering the Bell: High School Start Times and Student Academic Outcomes. Research in the area of health and sleep has encouraged educators and policymakers to look to delaying school starting times as an intervention with the potential to improve achievement and other relevant student outcomes. At this time, studies conducted on starting school days at a later time show mixed results. Although, a sufficient number of studies exist to suggest that moving back the start time of school can contribute to improving lagging student performance. This research finds starting school later is associated with reduced suspensions and higher course grades. These studies suggest disadvantaged students may especially benefit from delayed starting times. This study attempts to fill in the research gap on the topic of later start times as much of the earlier research has been conducted using small sample sizes. To increase the sample size needed to confirm previous research, Bastin and Fuller use statewide student-level data from North Carolina to estimate start time effects for all students and traditionally disadvantaged students. Statewide achievement results were mixed, with positive and negative associations found between start times and high school students’ test scores. Bastin and Fuller counsel for further research to increase confidence that later start times predictably produce desired outcomes. Studies of sufficient rigor, using multiple populations, and across different settings are required to address remaining issues and possible unintended consequences associated with changing start times.
Citation: Bastian, K. C., & Fuller, S. C. (2018). Answering the Bell: High School Start Times and Student Academic Outcomes. AERA Open, 4(4), 2332858418812424.
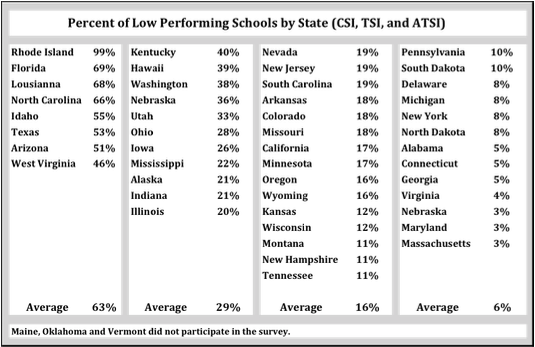
The Number of Low-Performing Schools by State in Three Categories (CSI, TSI, and ATSI), School Year 2018-19. Every Student Succeeds Act (ESSA) gives individual states significant flexibility as to how they identify “low performing schools”. This decision is extremely important as low performing school triggers mandates for states and districts to invest resources to improve them. The more schools identified, the bigger the responsibilities. ESSA identifies three categories of low-performing schools. Going from most intensive to least they include: Comprehensive Support and Improvement (CSI) schools, Targeted Support and Improvement (TSI) schools, and Additional Targeted Support and Improvement (ATSI) schools.
Ideally, each state would have consistent standards for identifying schools that are low performing. To date, there is no formal system in place to monitor these new standards. This report, completed by the Center on Education Policy, attempts to provide an initial snapshot of the number and percentages of schools each state has identified low performing. It has limitations in that states are in the early stages of implementation and calibration, states offered various degrees of cooperation, and some states had yet to complete implementation. Still, it does provide an early look at a very diverse set of guidelines.
The following chart captures their results.
Center on Education Policy (2019)
The data show a wide range of results in terms of the percentage of schools identified as low performing. The overall range is 3% to 99%, with individual states spread out fairly evenly in between. Eight states identified over 40% of their public schools as low performing, eleven states 20%–40%, fifteen states 11%–19%, and thirteen states 3%–10%. Even with the limitations of the data listed above, this data suggests inconsistent standards across states.
Citation: Stark Renter, D., Tanner, K., Braun, M. (2019). The Number of Low-Performing Schools by State in Three Categories (CSI, TSI, and ATSI), School Year 2018-19. A Report of the Center on Education Policy
The Condition of Education 2019 Newly Released. The Condition of Education 2019 is produced by The Institute for Education Sciences (IES) National Center for Education Statistics (NCES). This annual publication is one of the best ongoing sources for tracking and analyzing important developments and trends in education over time using the latest available data. It is essential that education systems have feedback mechanisms at the macro level. The 2019 report presents 50 key indicators on important topics and trends in U.S. education. These descriptive and performance indicators focus on family characteristics, such as educational attainment and economic outcomes; participation in education at all levels (preprimary, elementary, secondary and post secondary); and several contextual aspects of education, including international comparisons, at both the elementary and secondary education level and the postsecondary education level. Each year the report “spotlights” new supplemental indicators to provide more in-depth analyses on critical topics. In 2019 the spotlights were on: “Early Childhood Care Arrangements”; “Choices and Costs Characteristics of Public School Teachers Who Completed Alternative Route to Certification Programs”; and “Trends in Student Loan Debt for Graduate School Completers.”
Characteristics of Public School Teachers Who Completed Alternative Route to Certification Programs”; and “Trends in Student Loan Debt for Graduate School Completers.”
Citation: McFarland, J., Hussar, B., Zhang, J., Wang, X., Wang, K., Hein, S., Diliberti, M., Forrest Cataldi, E., Bullock Mann, F., and Barmer, A. (2019). e Condition of Education 2019 (NCES 2019-144). U.S. Department of Education. Washington, DC: National Center for Education Statistics. Retrieved [date] from https://nces.ed.gov/ pubsearch/pubsinfo.asp?pubid=2019144.
Are Students with Disabilities Accessing the Curriculum? A Meta-analysis of the Reading Achievement Gap between Students with and without Disabilities. A critical goal of federal education policy is improving students with disabilities participation in grade level curriculum. This meta-analysis examines 23 studies for student access to curriculum by assessing the gap in reading achievement between general education peers and students with disabilities (SWD). The study finds that SWDs performed more than three years below peers. The study looks at the implications for changing this pictures and why current policies and practices are not achieving the desired results.
Citation: Gilmour, A. F., Fuchs, D., & Wehby, J. H. (2018). Are students with disabilities accessing the curriculum? A meta-analysis of the reading achievement gap between students with and without disabilities. Exceptional Children. Advanced online publication. doi:10.1177/0014402918795830