Categories for External Influences
April 17, 2019
What Works Clearinghouse Intervention Report: National Board for Professional Teaching Standards Certification. NBPTS was established in 1987 to foster “high and rigorous standards for what accomplished teachers should know and be able to do” (NBPTS mission statement). As a voluntary national system, NBPTS certifies that a teacher has taught in the field and meets certification requirements for best practices for instruction and pedagogy. The standards reflect five core propositions: (1) effective teachers are committed to students and their learning, (2) effective teachers know the subjects they teach and how to teach those subjects to students, (3) effective teachers manage and monitor student learning, (4) effective teachers think systematically about their practice and learn from experience, and (5) effective teachers are members of learning communities.
The process requires teachers to pay a fee and can take from 3 months to several years to complete. School districts have come to view the process as a way to improve student achievement, allocating scarce resources in the form of performance compensation to encourage teachers who acquire certification. The What Works Clearinghouse review found NBPTS-certified teachers had mixed effects on mathematics achievement and no discernible effects on English language arts achievement for students in grades 3 through 8.
Citation: Mathematica Policy Research (2018). What Works Clearinghouse Intervention Report: National Board for Professional Teaching Standards Certification. Washington, DC: U.S. Department of Education, National Center for Education Statistics, National Assessment of Educational Progress (NAEP). Retrieved from https://ies.ed.gov/ncee/wwc/Docs/InterventionReports/wwc_nbpts_021318.pdf.
Link: https://ies.ed.gov/ncee/wwc/Docs/InterventionReports/wwc_nbpts_021318.pdf
April 15, 2019
Proceed With Caution: Using Web-Based Resources for Instructing Students With and at Risk for EBD. This article examines issues relating to the use of websites popular with educators. Today educators often rely on social media platforms such as Pinterest and Teachers Pay Teachers for information for solving problems encountered in the classroom. These sites can offer teachers helpful information, but also come with potential risks that educators need to consider when utilizing such resources. This article offers guidelines for maximizing the usefulness of such sites and for avoiding many of the pitfall educators may face. The authors suggest educators first identify and learn the critical elements of effective practices from trustworthy sources and then use sites such as Pinterest and Teachers Pay Teachers to facilitate implementation.
Citation: Beahm, L. A., Cook, B. G., & Cook, L. (2019). Proceed With Caution: Using Web-Based Resources for Instructing Students With and at Risk for EBD. Beyond Behavior, 28(1), 13-20.
Link: https://journals.sagepub.com/doi/abs/10.1177/1074295619836076
https://www.researchgate.net/publication/332296285_Proceed_With_Caution_Using_Web-Based_Resources_for_Instructing_Students_With_and_at_Risk_for_EBD
April 12, 2019
Decades of research document the significant negative impacts of student absenteeism on academic achievement, emotional development, graduation, health, and long-term success (Gottfried, 2015). Yet, until just a few years ago, the U.S. K–12 education system was virtually unaware that it had a chronic student absenteeism problem. Prior to that time, chronic absenteeism was never tracked by school systems, let alone addressed. A recent analysis of the data revealed that a significant number of students (one in seven) were chronically absent, defined as missing 10% of school days (Balfanz & Brynes, 2012). And that was the threshold number. Many students identified as chronically absent missed more than 10%. The corresponding negative impacts worsen with every additional day of school missed.
This overview looks at the best available evidence on chronic student absenteeism in the context of (1) the scale of the problem at all levels of the education system: national, state, school, and grade; (2) the impact on student academic performance, graduation, health, and financial impact on school districts; (3) impact multipliers that exacerbate chronic absenteeism, such as poverty, student mobility, homelessness, and disciplinary suspensions; and (4) interventions utilizing a public health tiered model for different levels of action depending on need, a performance feedback system to track and modify the results of each intervention, and coordination of resources across a wide range of education stakeholders.
Citation: Keyworth, R., Detrich, R. & States, J. (2019). Overview of Chronic Student Absenteeism: A Significant and Overlooked Obstacle to Student Achievement. Oakland, CA: The Wing Institute. https://www.winginstitute.org/perform-levels-student.
Link: https://www.winginstitute.org/student-chronic-absenteeism
March 21, 2019
The Value of Smarter Teachers: International Evidence on Teacher Cognitive Skills and Student Performance: This new research addresses a number of critical questions: Are a teacher’s cognitive skills a good predictor of teacher quality? Using this measure, does teacher quality account for the wide variation of student achievement across ours and other nations? This study examines the student achievement of 36 developed countries in the context of teacher cognitive skills. It uses data from the Organization for Economic Cooperation and Development (OECD) which generates the Programme for International Student Assessment (PISA) which tests the literacy and numeracy skills of 15 year old students and the Programme for the International Assessment of Adult Competencies (PIAAC) which tests literacy and numeracy skills of adults 16-65 (which includes teachers).
Existing research demonstrates that teachers have the greatest impact of any other school-based factor. It also tells us that teachers’ experience, advanced degrees, and professional development are not very good predictors of teacher effectiveness. There is increasing evidence that a teacher’s own scholastic performance (literacy and numeracy cognitive skills) is consistently related to student outcomes.
The study used multiple approaches to examine the data, and found that: (1) there was great variability in both student achievement and teachers’ cognitive skills across countries, (2) the higher the teachers’ cognitive skills, the more academically successful the students, (3) the effects were more pronounced within a subject area (teachers with higher numeracy skills in math produced higher student achievement in math than reading and vice versa), and (4) students performed better where teachers had higher salaries. One of the implications of the study is the value of targeting potential teachers with higher cognitive skills. High scoring Singapore, Finland, and Korea recruit their teachers exclusively from the top third of their college graduating class. Less than a quarter of U.S. teachers came from this same group.
Citation: Hanushek, E. A., Piopiunik, M., & Wiederhold, S. (2014). The value of smarter teachers: International evidence on teacher cognitive skills and student performance (No. w20727). National Bureau of Economic Research.
Link: http://hanushek.stanford.edu/sites/default/files/publications/Hanushek%2BPiopiunik%2BWiederhold_JHR.pdf
March 19, 2019
Status and Trends in the Education of Racial and Ethnic Groups 2018: This report examines key indicators on the educational progress and challenges students face in the United States by race/ethnicity. There is extensive data on thirty indicators across home, K-12 education, and postsecondary environments, including: demographics, education participation, achievement, student behavior, completion rates, and post school results. The report also has special sections on public school teachers by race/ethnicity and characteristics of postsecondary institutions serving specific minority racial/ethnic groups.
A sample of the many analyses include: (1) the percentage of children under the age of 18 living in poverty was 31% for Black children, 26% for Hispanic, 10% for White, and 10% for Asian; (2) over half of Hispanic (60%) and Black (58%) students attended schools where the enrollment of minority students was at least 75% of total enrollment versus 38% of Asian students and 5% of White students; (3) there has been no significant change in the reading and math White-Black and White-Hispanic achievement gaps; (4) over 5% of public school students received one or more out-of-school suspensions: 13.7% of Black students, 4.5% of Hispanic, 3.4% of White, and 1.1% of Asian; (5) from 2000 to 2016 the high school status completion rate for Hispanic increased from 64 to 89 percent, for Black students 84 – 92%, and White students 92 – 94%,
Citation: de Brey, C., Musu, L., McFarland, J., Wilkinson-Flicker, S., Diliberti, M., Zhang, A., Branstetter, C., and Wang, X. (2019). Status and Trends in the Education of Racial and Ethnic Groups 2018 (NCES 2019-038). U.S. Department of Education. Washington, DC: National Center for Education Statistics. Retrieved [date] from https://nces.ed.gov/ pubsearch/.
Link: https://nces.ed.gov/pubs2019/2019038.pdf
February 1, 2019
The Link Between School Attendance and Good Health. The American Academy of Pediatrics just released a policy statement regarding the negative impact that chronic student absenteeism has on children’s health. They cite numerous ways the two are linked. First, evidence clearly documents that chronic absenteeism puts children at a much higher risk of dropping out of school and not graduating. There is a significant amount of research associating poor school performance (resulting in lower education attainment) and poor adult health outcomes, including increased mortality risk and lower life expectancy. The act of missing school itself is also linked to increased risk behaviors, including alcohol consumption, drug use, smoking and risky sexual behavior. Also, children with chronic absenteeism are 3.5 times more likely to be arrested or referred to the juvenile justice system. The policy statement finishes with a discussion of roles the medical community can play working with schools and families to help address this problem. It reviews the evidence regarding possible physical and mental health interventions, including: infection prevention programs, school nurses, school-based health centers, mental health care, health awareness school policies and programs, parent interventions, and coordinated school health models.
Citation: Allison, M. A., & Attisha, E. (2019). The Link Between School Attendance and Good Health. Pediatrics, e20183648.
Link: http://pediatrics.aappublications.org/content/pediatrics/early/2019/01/24/peds.2018-3648.full.pdf
January 31, 2019
Digest of Education Statistics 2017: The Digest of Education Statistics 2017was just released by The Institute for Education Sciences (IES) National Center for Education Statistics (NCES). This annual publication is thedefinitive compendium of data on virtually every aspects of education from pre-kindergarten through graduate school. Its chapters include: All Levels of Education, Elementary and Secondary Education, Postsecondary Education, Federal Funds for Education and Related Activities, Outcomes of Education, International Comparisons of Education, and Libraries and Use of Technology. It draws from a wide range of government and private sources and applies rigorous review to everything published. It has been published annually since 1962, providing over 50 years of data with which to benchmark education performance at the system level in this country.
Citation: Snyder, T.D., de Brey, C., and Dillow, S.A. (2019). Digest of Education Statistics 2017 (NCES 2018-070). National Center for Education Statistics, Institute of Education Sciences, U.S. Department of Education. Washington, DC.
Link: https://nces.ed.gov/pubs2018/2018070.pdf
January 31, 2019
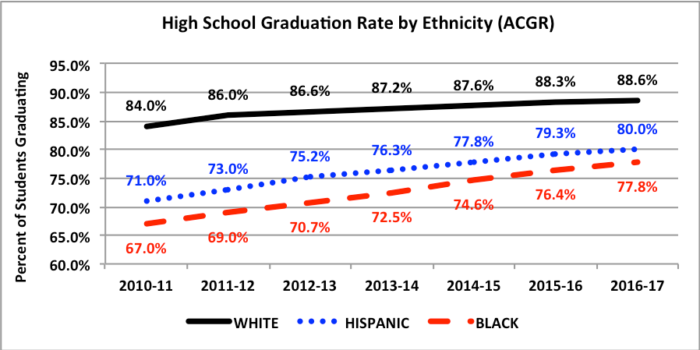
Digest of Education Statistics 2017. The most recent high school graduation rate data were just released for the 2016-17 school year. The following graph shows consistent improvement in this critical student and school performance metric. Student graduation increased by 12 percentage points during the fifteen years from 2002 and 2017. While there is still much work to be done to identify and implement graduation standards that translate into meaningful and life long benefits, this type of consistent performance improvement should be acknowledged.
•AFGR: The Average Freshman Graduation Rate (AFGR) was used by the U.S. Department of Education (DOE) from 2002 through 2013.
•ACGR: The Four-Year Adjusted Cohort Graduation Rate (ACGR) was established by DOE in 2008, establishing a uniform and more accurate measure for calculating the rate at which students graduated from high school.
Both models co-existed for threes years and had comparable graduate rate data during that time.
A second area of the report disaggregates graduation rate data by students from different ethnic backgrounds. There remains an unacceptable graduation rate gap between White and Black students, and White and Hispanic students. The resulting graduation rate for Black students (77.8%) and Hispanic students (80.0%) are failures of the system. While progress will always be too slow in this area, the data do show steady progress in closing the gap over the last six years. The graduation gap between White and Black students decreased by 6.2 percentage points (from 17% in 2010-11 to 10.8% in 2016-17). The graduation gap between White and Hispanic students decreased by 4.4 percentage points (from 13% in 2010-11 to 8.6% in 2016-17).
A third area of disaggregated data was that of graduation rates by individual states. The variation between states continues to be extreme with the top ten states averaging a 89.7% graduation rate and the bottom ten states averaging 77.4%.
Improving graduation rates continue to be a clear focus of the education system, and while there is a long way to go, it is one of the few areas where progress is being made.
Citation: Snyder, T.D., de Brey, C., and Dillow, S.A. (2019). Digest of Education Statistics 2017 (NCES 2018-070). National Center for Education Statistics, Institute of Education Sciences, U.S. Department of Education. Washington, DC.
Link: https://files.eric.ed.gov/fulltext/ED592104.pdf
December 21, 2018
“Trends in High School Dropout and Completion Rates in the United States: 2018”. Dropping out of high school has significant negative impacts on students. Statistically, they will have lower earnings than high school graduates, are more likely to be unemployed, have poorer health, and have a higher rate of incarceration. This report provides a detailed analysis of long-term dropout and completion trends and student characteristics of high school dropouts and completers. The first measure examined was the “event dropout rate” which is the percent of students who drop out in grades 10-12 without a high school diploma or alternative credential. The event dropout rate for SY 2015-16 was 4.8%, which translated into 532,000 students.
The 40 year trend show an alarming lack of progress. While 2015-16 was lower than in 1976 (5.8%), it reflects a worsening over the last ten years (increasing from 3.8% to 4.8%). Of all of the student demographic data, the clearest impact was that of family income. Students from the lowest income families had a 7.2% dropout rate compared to 3.9% for highest income families. The “adjusted cohort graduation rate” for 2015-16 was 84% which showed steady improvement over the past five years. The main problem is the significant differences in graduate rates across race, economic status, states, and disabilities. For example, graduation rates for white students ranged from 76% in New Mexico to 94% in New Jersey; black students from 57% in Nevada to 88% in West Virginia; Hispanic students from 65% in Minnesota to 89 % in Vermont.
Citation:
McFarland, J., Cui, J., Rathbun, A., and Holmes, J. (2018). Trends in High School Dropout and Completion Rates in the United States: 2018 (NCES 2019-117). U.S. Department of Education. Washington, DC: National Center for Education Statistics. Retrieved December 14, 2018 from http://nces.ed.gov/pubsearch.
Link: https://nces.ed.gov/pubs2019/2019117.pdf
November 28, 2018
Evaluating the Relationships Between Poverty and School Performance
One of the most critical issues facing K-12 education is the impact that poverty has on school performance. This study first examines school performance using traditional metrics for school poverty levels (percent of student body that qualify for free and reduced lunch: FRL) and school performance (school achievement based on the aggregate test scores of its student body). The results support prior research documenting the negative relationship between the level of poverty in a school and student achievement (the higher the poverty the lower the achievement). However, when replacing the student achievement metric with a student growth metric, the relationship is significantly different.
This NWEA study argues that, while it is important to measure and report a school’s student achievement, it is often a function of the demographics of a school’s population rather than a school’s effectiveness at teaching. Student growth tracks the learning of students regardless of their poverty level and is a more useful tool for comparing individual school performance. Sixty percent of schools with high poverty student populations had above average student growth. And a larger percentage of high poverty schools demonstrated substantial growth than schools from wealthy communities. The dramatic negative relationship between poverty and student achievement was much less evident when looking at student growth, and much more nuanced.
The implications of the study are profound. First, it highlights the need for school performance measures to include student growth in addition to school achievement. Both are critical measures. More importantly, it raises the question: If students make comparable progress during the school year regardless of their poverty level, what accounts for the significant differences in test scores. One study tracked the performance of students by poverty level and their performance on tests administered at the beginning and end of each school year. The data showed a clear pattern. Students of all socio economic groups made comparable progress during the school year. The biggest, and compounding gaps, occurred during the summer months suggesting that poverty’s largest impact occurs outside of school.
Citation:Alexander, K. L., Entwisle, D. R., & Olson, L. S. (2001). Schools, achievement, and inequality: A seasonal perspective. Educational Evaluation and Policy Analysis, 23, 171–191.
Link: https://www.nwea.org/content/uploads/2018/10/Evaluating-the-Relationships-Between-Poverty-and-School-Performance.pdf