The trouble with teacher turnover: How teacher attrition affects students and schools. Schools in the United States continue to experience a shortage of classroom teachers. Teacher shortages negatively impact school systems, including but not limited to student learning and available district resources. This study finds higher turnover rates in the southern states; among mathematics, science, special education, English language development, and foreign language teachers; in schools serving students of color and from low-income families; and among teachers of color. The analysis reveals factors associated with higher turnover rates, ranging from insufficient administrative support to teacher compensation. Finally, the paper proposes strategies to address teacher turnover to ensure a stable teacher workforce.
Citation: Carver-Thomas, D., & Darling-Hammond, L. (2019). The trouble with teacher turnover: How teacher attrition affects students and schools. education policy analysis archives, 27, 36.
The Unavoidable: Tomorrow’s Teacher Compensation. This research examines the issue of teacher compensation. The author finds that teachers earn significantly less than they could make working in other comparable fields. The results show teacher salaries have been stagnant as a result of money has been funneled to increasing the number of educators and support personnel in schools. An examination of school expenditures reveals substantial growth in the costs of teacher pensions, and health care coverage has negatively affected teacher compensation. Consequently, inadequate teacher compensation reduces teacher retention and, ultimately, the quality of instruction. The research cautions against merely throwing money at the problem, as is commonly the case in many policy initiatives that do not directly impact how teachers teach.
Citation: Hanushek, E. A. (2020). The Unavoidable: Tomorrow’s Teacher Compensation. Stanford Hoover Education Success Initiative. http://hanushek.stanford.edu/publications/unavoidable-tomorrow’s-teacher-compensation
Decreasing Inappropriate Behavior Overview. Teachers place inappropriate conduct at the top of the list of challenges they face. Unacceptable behavior ranges from problematic speech to violence. Evidence supports a continuum of strategies to decrease inappropriate behavior, beginning with the least intrusive and progressing through increasingly restrictive interventions. A simple but effective intervention is explicit student reprimand, a brief correction defining the error and explaining how to improve. Performance feedback is a more formal strategy that uses comments, charts, graphs, and reports to assist students analyze and improve performance by specifying expected behavior, unacceptable performance, and the consequences for each. Basic to reducing inappropriate conduct is planned ignoring (extinction), or withholding attention when misbehavior occurs. A multiform intervention is differential reinforcement. It combines reinforcement for appropriate behavior and ignoring misbehavior in various arrangements by increasing desired behavior to replace or decrease misbehavior. Systems that award points for appropriate behavior and remove points for misbehavior (response cost) are also effective. A more restrictive option for serious disruptive conduct is time out. It is the removal of a student to a less reinforcing environment when undesired behavior occurs.
Citation: Guinness, K., Detrich, R., Keyworth, R. & States, J. (2020). Overview of Decreasing Inppropriate Behavior. Oakland, CA: The Wing Institute. https://www.winginstitute.org/classroom-inappropriate-behaviors.
Examining the NAEP 2019 Results in Terms of Equity. Benchmark indicators are critical tools to help education stakeholders track their education system’s performance (1) over time, (2) in comparison to other similar level education systems and (3) across student groups. They also can provide critical information regarding the “equity” in a system. In other words, to what extent does a student’s ethnicity, socio economic status, or location predict/impact their education performance. One of the most respected tools for answering this question is the National Assessment of Educational Progress (NAEP), as it disaggregates test data by student ethnicity, socio-economic status, and location of schools. The most recent test results (NAEP 2019) suggest we have significant inequities in our K-12 education system.
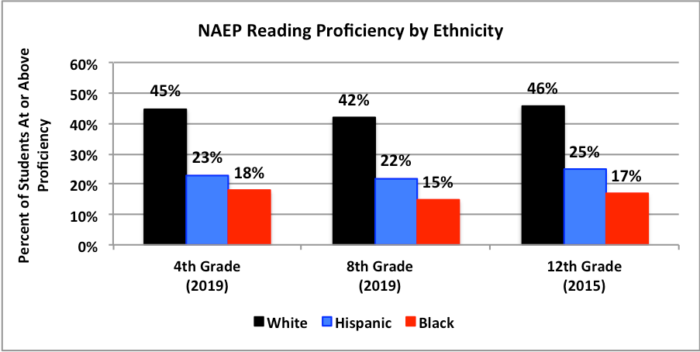
The following figure maps out education performance by ethnicity and grade level for reading proficiency. “At or above proficiency” becomes a critical benchmark because it is the level at which students have met the standards for a subject area. It is also a benchmark metric by which most states school districts accountable.
Figure 1
This most recent NAEP data suggest that there is significant inequality in learning outcomes in the U.S. education system for children of particular ethnicities (Black, Hispanic).
In 2019, there was a significant gap in fourth-grade reading proficiency between White (45%) and Hispanic (23%) students (22 percentage points) and between White (45%) and Black (18%) students (a difference of 27 percentage points)..
The gap does not change significantly over the remaining two tested grades. The White – Hispanic gap is 20% in 8th grade, and 21% in 12th grade. The White – Black gap is 27% in 8th grade and 29% in 12th grade.
The gaps have remained virtually constant over the testing years going back to 1992. In 1992, the fourth-grade reading proficiency gap between White and Hispanic students was 23 percentage points, and between White and Black was 27 percentage points.
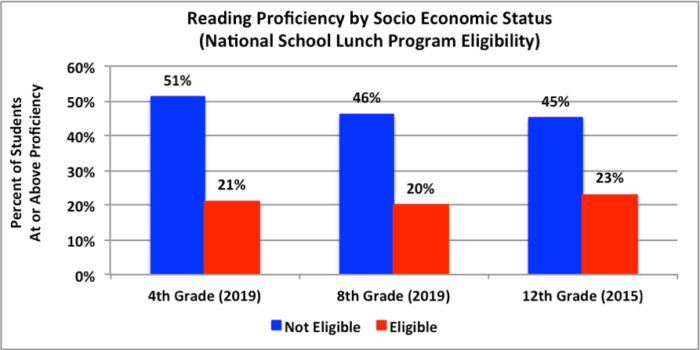
A similar NAEP analysis examines the reading performance for students based on their socio economic status. Children’s eligibility for the National School Lunch Program (NSLP) is used to identify low-income families.
Figure 2
As with ethnicity, NAEP data for reading proficiency across grades show an enormous gap between students who are lower income and those with higher income. In 2019, there was a significant gap in fourth-grade reading proficiency between students from higher income families and those from lower income families (30%). In eighth-grade the gap was 26 points and in twelfth grade 22 points.
These gaps, and their resulting low proficiency scores, definitely document a system that is out of balance when it comes to providing equitable outcomes across ethnicity and SES.
Citation(s): National Center for Education Statistics. (2019). Nation’s report card. National Assessment of Educational Progress.
National Center for Education Statistics. (2019). NAEP Data Explorer. National Assessment of Educational Progress.
Why is this question important? Given the limited resources that are available for the education of children, it is important to select interventions that have the greatest impact we can afford. Using Stuart Yeh’s effectiveness cost ratio formula, a rough comparison can be drawn comparing class size reduction with other educational interventions.
Citation: Yeh, S. S. (2007). The Cost-Effectiveness of Five Policies for Improving Student Achievement, American Journal of Evaluation, 28(4), 416-436.
Research Synthesis of Meta-Analyses of Preservice Teacher Preparation Practices in Higher Education. Identification of best practices in teacher preservice training remains one of the top goals of education reform. This research synthesis of teacher preparation practices examines meta-analyses on the topic to identify those practices that predictably lead to effective classroom instruction. The paper examines practices such as teacher degrees, preparation models, methods of course delivery, technology-based instruction, cooperative learning practices, instruction methods, field experience, field experience supervision, and induction practices. A cluster of six practices was associated with a medium effect size of preservice teacher training and positive educational outcomes. The highest impact practices include; extended student teaching (ten or more weeks), simulated instruction with practice, coaching and feedback, critical thinking instruction, micro-teaching, peer instruction, and course-based learning practices. Low impact practices identified in the study are teacher degree, number of education classes, explanation-based teaching methods, teacher certification, extended preparation programs, first-year teaching seminars, and teacher induction. The study finds high impact training practices to be reliable indicators that produce the most effective teachers. The results are consistent with previous research supporting course instruction linked to classroom teaching experiences, coaching while working with children in classrooms, frequent feedback based on observations of the preservice teachers performing tasks using evidence-based teaching methods.
Citation: Dunst, C. J., Hamby, D. W., Howse, R. B., Wilkie, H., & Annas, K. (2020). Research Synthesis of Meta-Analyses of Preservice Teacher Preparation Practices in Higher Education. Higher Education, 10(1).
Does School Spending Matter? The New Literature on an Old Question. The impact of school finances on student achievement has long interested educators. Research conducted before the mid-1990s suggested a link between the available resources provided schools and student outcomes, but much of this research is correlational. Because correlational research cannot imply causation, studies of a more rigorous nature are needed if policymakers are to redesign school financing that predictably maximizes learning for all students, regardless of the parent’s socio-economic status. Recently published studies employing larger data-sets and based on quasi-experimental methods offer a clearer understanding of how schools might be better funded. This paper of American United States school finances finds evidence to support the importance of providing equitable funding across school districts. These results have important policy implications and suggest areas for future research.
Citation: Jackson, C. K. (2018). Does school spending matter? The new literature on an old question (No. w25368). National Bureau of Economic Research.
Overview of Value-Added Research in Education: Reliability, Validity, Efficacy, and Usefulness. Value-added modeling (VAM) is a statistical approach that provides quantitative performance measures for monitoring and evaluating schools and other aspects of the education system. VAM comprises a collection of complex statistical techniques that use standardized test scores to estimate the effects of individual schools or teachers on student performance. Although the VAM approach holds promise, serious technical issues have been raised regarding VAM as a high-stakes instrument in accountability initiatives. The key question remains: Can VAM scores of standardized test scores serve as a proxy for measuring teaching quality? To date, research on the efficacy of VAM is mixed. There is a body of research that supports VAM, but there is also a body of studies suggesting that model estimates are unstable over time and subject to bias and imprecision. A second issue with VAM is the sole use of standardized tests as a measure of student performance. Despite these valid concerns, VAM has been shown to be valuable in performance improvement efforts when used cautiously in combination with other measures of student performance such as end-of-course tests, final grades, and structured classroom observations.
Citation: Cleaver, S., Detrich, R. & States, J. (2020). Overview of Value-Added Research in Education: Reliability, Validity, Efficacy, and Usefulness. Oakland, CA: The Wing Institute. https://www.winginstitute.org/staff-value-added.
Trend in High School Dropout and Completion Rates in the United States: 2018. This report provides the most recent year of data available for each dropout and completion rate, summarizes long-term trends, and examines the characteristics of high school dropouts and completers. Five rates are presented to provide a broad perspective on high school dropouts and completers in the United States: the event dropout rate, the status dropout rate, the status completion rate, the adjusted cohort graduation rate, and the averaged freshman graduation rate. The report also provides information about individuals who completed an alternative high school credential.
Citation: McFarland, J., Cui, J., Rathbun, A., and Holmes, J. (2019). Trend in High School Dropout and Completion Rates in the United States:2018. National Center for Education Statistics. NCES 2019-117 US Department of Education.
What to Make of Declining Enrollment in Teacher Preparation Programs. This policy report provides a look at the decline in the enrollment of American teacher preparation programs, along with potential consequences for schools and the students they serve. The analysis offers education policymakers with insight into the complex issues involved in maintaining sufficient numbers of qualified teachers. While enrollment in teacher preparation programs has declined by more than one-third since 2010, the analysis described in this report paints a more complex and nuanced picture than the national numbers portray. The study finds significant variations among states in the change in enrollment in teacher preparation programs.