What the 2019 National Assessment of Education Progress (NAEP) Results Tell Us About Equity in K-12
January 28, 2020Examining the NAEP 2019 Results in Terms of Equity. Benchmark indicators are critical tools to help education stakeholders track their education system’s performance (1) over time, (2) in comparison to other similar level education systems and (3) across student groups. They also can provide critical information regarding the “equity” in a system. In other words, to what extent does a student’s ethnicity, socio economic status, or location predict/impact their education performance. One of the most respected tools for answering this question is the National Assessment of Educational Progress (NAEP), as it disaggregates test data by student ethnicity, socio-economic status, and location of schools. The most recent test results (NAEP 2019) suggest we have significant inequities in our K-12 education system.
The following figure maps out education performance by ethnicity and grade level for reading proficiency. “At or above proficiency” becomes a critical benchmark because it is the level at which students have met the standards for a subject area. It is also a benchmark metric by which most states school districts accountable.
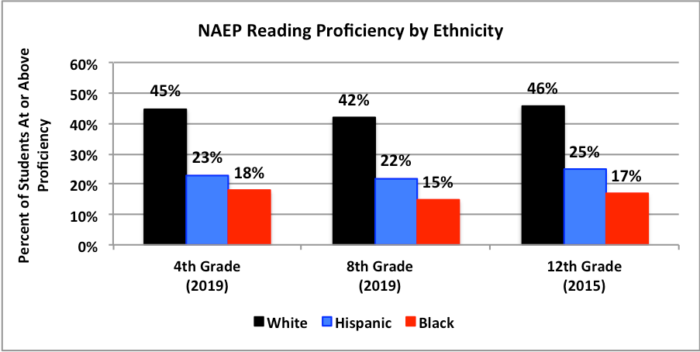
This most recent NAEP data suggest that there is significant inequality in learning outcomes in the U.S. education system for children of particular ethnicities (Black, Hispanic).
- In 2019, there was a significant gap in fourth-grade reading proficiency between White (45%) and Hispanic (23%) students (22 percentage points) and between White (45%) and Black (18%) students (a difference of 27 percentage points)..
- The gap does not change significantly over the remaining two tested grades. The White – Hispanic gap is 20% in 8th grade, and 21% in 12th grade. The White – Black gap is 27% in 8th grade and 29% in 12th grade.
- The gaps have remained virtually constant over the testing years going back to 1992. In 1992, the fourth-grade reading proficiency gap between White and Hispanic students was 23 percentage points, and between White and Black was 27 percentage points.
A similar NAEP analysis examines the reading performance for students based on their socio economic status. Children’s eligibility for the National School Lunch Program (NSLP) is used to identify low-income families.
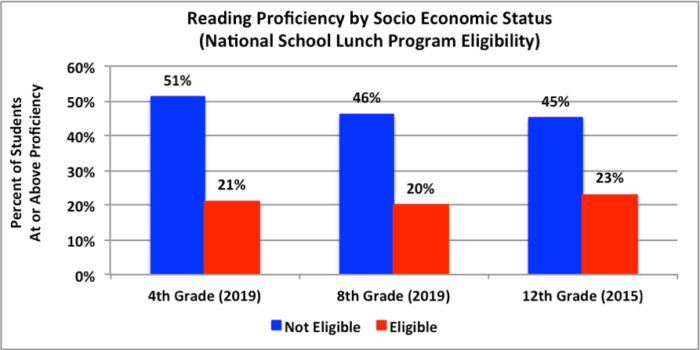
As with ethnicity, NAEP data for reading proficiency across grades show an enormous gap between students who are lower income and those with higher income. In 2019, there was a significant gap in fourth-grade reading proficiency between students from higher income families and those from lower income families (30%). In eighth-grade the gap was 26 points and in twelfth grade 22 points.
These gaps, and their resulting low proficiency scores, definitely document a system that is out of balance when it comes to providing equitable outcomes across ethnicity and SES.
Citation(s): National Center for Education Statistics. (2019). Nation’s report card. National Assessment of Educational Progress.
National Center for Education Statistics. (2019). NAEP Data Explorer. National Assessment of Educational Progress.