Increasing Teachers’ Use of Behavior-Specific Praise with the Teacher vs. Student Game. Research has long supported the importance of teacher behavior specific praise in the classroom. This study examines the impact of a Teacher Versus Student Game, a program that is based upon The Good Behavior Game (GBG). GBG has been in use since 1967 and is an evidence-based behavioral classroom management strategy that helps children learn how to work together to create a positive learning environment. Pressure for teachers to show academic results is hindered by challenging student conduct. Maintaining control of student behavior is a critical factor in teacher’s ability to effectively deliver instruction that results in increased student academic outcomes. Using group contingencies found in the Teacher Versus Student Game provides teachers another program designed to accomplish this important goal. This paper found that the game increased teachers rates of praise; however, the teachers gradually decreased their use of BSP over time.
Two additional papers on practices to increase teacher praise are identified under citations.
Gage, N. A., MacSuga-Gage, A. S., & Crews, E. (2017). Increasing teachers’ use of behavior-specific praise using a multitiered system for professional development. Journal of Positive Behavior Interventions, 19(4), 239-251.
White, K. (2018). Increasing Teachers’ Use of Behavior Specific Praise Via a Smart Watch.
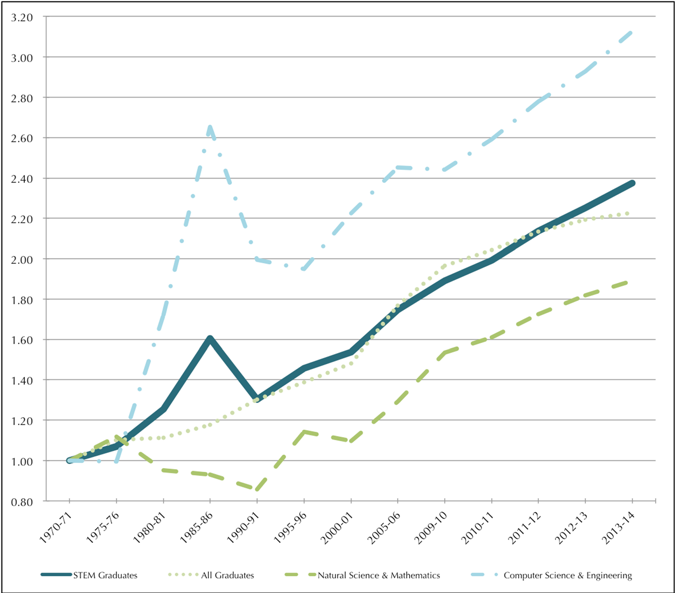
STEM Performance and Supply: Assessing the Evidence for Education. Policy. Concerns that the United States is not training a sufficient number of students in the fields of science, technology, engineering, mathematics (STEM) has been of ongoing concern for policy makers for decades. This study examines the evidence and concludes that U.S. education system is producing ample supplies of students to respond to STEM labor market demand.
Bachelor’s degree graduates: rate of growth from 1970 base year (Source: Digest of Education Statistics, 2015 NCES . (calculations by authors)
Citation:Salzman, H., & Benderly, B. L. (2019). STEM Performance and Supply: Assessing the Evidence for Education Policy. Journal of Science Education and Technology, 28(1), 9-25.
Big Data and data science: A critical review of issues for educational research. Big data proliferates across a wide spectrum of fields in the 21stcentury. Education is no exception. This paper examines critical issues that must be considered to maximize the positive impact of big data and minimize negative effects that are currently encountered in other domains. This review is designed to raise awareness of these issues with particular attention paid to implications for educational research design in order that educators can develop the necessary policies and practices to address this complex phenomenon and its possible implications in the field of education.
Citation: Daniel, B. K. (2017). Big Data and data science: A critical review of issues for educational research. British Journal of Educational Technology.
Meta-Analysis of Criterion Validity for Curriculum-Based Measurement in Written Language. A shout out to one of the Wing Institute’s past student grant recipients, John Romig. A recent study in which he was the lead author, looks at valid measures of student progress as critical tools in effective and efficient progress monitoring. One of the most frequently adopted instruments is curriculum-based measures. Curriculum-based measures (CBM) have been used to assess student progress in reading, arithmetic, spelling, and writing. For CBM to be widely embraced these tools should meet standards for reliability and validity. This study examines the technical adequacy of curriculum-based measures for written language, one of the critical skills required for student success in school. The study concludes two scoring procedures, correct word sequences and correct minus incorrect sequences met criterion validity with commercially developed and state or locally developed criterion assessments.
Citation: Romig, J. E., Therrien, W. J., & Lloyd, J. W. (2017). Meta-analysis of criterion validity for curriculum-based measurement in written language. The Journal of Special Education, 51(2), 72-82.
The Link Between School Attendance and Good Health. The American Academy of Pediatrics just released a policy statement regarding the negative impact that chronic student absenteeism has on children’s health. They cite numerous ways the two are linked. First, evidence clearly documents that chronic absenteeism puts children at a much higher risk of dropping out of school and not graduating. There is a significant amount of research associating poor school performance (resulting in lower education attainment) and poor adult health outcomes, including increased mortality risk and lower life expectancy. The act of missing school itself is also linked to increased risk behaviors, including alcohol consumption, drug use, smoking and risky sexual behavior. Also, children with chronic absenteeism are 3.5 times more likely to be arrested or referred to the juvenile justice system. The policy statement finishes with a discussion of roles the medical community can play working with schools and families to help address this problem. It reviews the evidence regarding possible physical and mental health interventions, including: infection prevention programs, school nurses, school-based health centers, mental health care, health awareness school policies and programs, parent interventions, and coordinated school health models.
Citation: Allison, M. A., & Attisha, E. (2019). The Link Between School Attendance and Good Health. Pediatrics, e20183648.
Digest of Education Statistics 2017: The Digest of Education Statistics 2017was just released by The Institute for Education Sciences (IES) National Center for Education Statistics (NCES). This annual publication is thedefinitive compendium of data on virtually every aspects of education from pre-kindergarten through graduate school. Its chapters include: All Levels of Education, Elementary and Secondary Education, Postsecondary Education, Federal Funds for Education and Related Activities, Outcomes of Education, International Comparisons of Education, and Libraries and Use of Technology. It draws from a wide range of government and private sources and applies rigorous review to everything published. It has been published annually since 1962, providing over 50 years of data with which to benchmark education performance at the system level in this country.
Citation: Snyder, T.D., de Brey, C., and Dillow, S.A. (2019). Digest of Education Statistics 2017 (NCES 2018-070). National Center for Education Statistics, Institute of Education Sciences, U.S. Department of Education. Washington, DC.
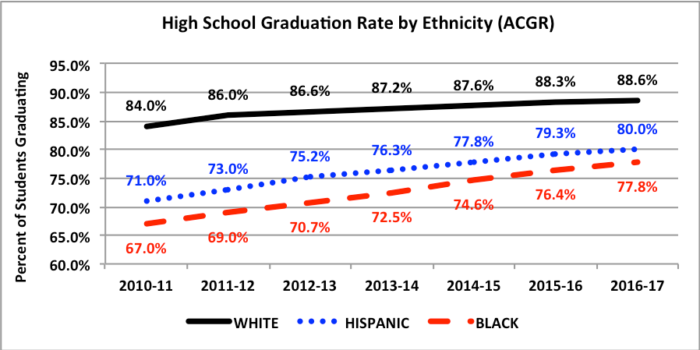
Digest of Education Statistics 2017. The most recent high school graduation rate data were just released for the 2016-17 school year. The following graph shows consistent improvement in this critical student and school performance metric. Student graduation increased by 12 percentage points during the fifteen years from 2002 and 2017. While there is still much work to be done to identify and implement graduation standards that translate into meaningful and life long benefits, this type of consistent performance improvement should be acknowledged.
•AFGR: The Average Freshman Graduation Rate (AFGR) was used by the U.S. Department of Education (DOE) from 2002 through 2013.
•ACGR: The Four-Year Adjusted Cohort Graduation Rate (ACGR) was established by DOE in 2008, establishing a uniform and more accurate measure for calculating the rate at which students graduated from high school.
Both models co-existed for threes years and had comparable graduate rate data during that time.
A second area of the report disaggregates graduation rate data by students from different ethnic backgrounds. There remains an unacceptable graduation rate gap between White and Black students, and White and Hispanic students. The resulting graduation rate for Black students (77.8%) and Hispanic students (80.0%) are failures of the system. While progress will always be too slow in this area, the data do show steady progress in closing the gap over the last six years. The graduation gap between White and Black students decreased by 6.2 percentage points (from 17% in 2010-11 to 10.8% in 2016-17). The graduation gap between White and Hispanic students decreased by 4.4 percentage points (from 13% in 2010-11 to 8.6% in 2016-17).
A third area of disaggregated data was that of graduation rates by individual states. The variation between states continues to be extreme with the top ten states averaging a 89.7% graduation rate and the bottom ten states averaging 77.4%.
Improving graduation rates continue to be a clear focus of the education system, and while there is a long way to go, it is one of the few areas where progress is being made.
Citation: Snyder, T.D., de Brey, C., and Dillow, S.A. (2019). Digest of Education Statistics 2017 (NCES 2018-070). National Center for Education Statistics, Institute of Education Sciences, U.S. Department of Education. Washington, DC.
A recent article published in Best Evidence in Brief examines the issues of quantity and quality of education research. Robert Slavin highlights the progress made over the past 30 years in delivering the evidence that education practitioners need to make informed decisions. His conclusions are based on three studies: Effective Programs for Struggling Readers: A Best-Evidence Synthesis; A Synthesis of Quantitative Research on Reading Programs for Secondary Students; and Effective Programs in Elementary Mathematics: A Best-Evidence Synthesis. The research found that the number of rigorous randomized or quasi-experimental studies in elementary reading for struggling readers, secondary reading, and elementary math rose significantly over the past 20 years. Despite the important gains, the trend may be going in the wrong direction. Given the importance of research in developing an effective evidence-based culture in education, educators need to diligently support the production of the types of research (including replication studies) essential to building a robust evidence base.
Baye, A., Inns, A., Lake, C., & Slavin, R. E. (2018). A synthesis of quantitative research on reading programs for secondary students. Reading Research Quarterly.
Inns, A., Lake, C., Pellegrini, M., & Slavin, R. (2018). Effective programs for struggling readers: A best-evidence synthesis.Paper presented at the annual meeting of the Society for Research on Educational Effectiveness, Washington, DC.
Pellegrini, M., Inns, A., & Slavin, R. (2018). Effective programs in elementary mathematics: A best-evidence synthesis.Paper presented at the annual meeting of the Society for Research on Educational Effectiveness, Washington, DC.
When Evidence-based Literacy Programs Fail. This study examines the implementation of Leveled Literacy Intervention (LLI) for struggling readers that had been proven to work in early grades. Disappointingly, the results showed after an average of 19 weeks of instruction the intervention had no impact on students’ reading comprehension and a negative impact on their mastery of ELA/literacy standards. The LLI impact on Smarter Balanced ELA/literacy scores was roughly equivalent to students losing more than five months of learning, based on the typical annual growth of students in grades 6-8. When the results were deconstructed, it was found that the failure to overcome obstacles to effective implementation played a significant role in the failure of the program to produce the anticipated results. The findings highlight the importance of considering context and implementation, in addition to evidence of effectiveness, when choosing an intervention program. Not only do schools need to adopt programs supported by evidence, but equally educators need to implement them consistently and effectively if students are to truly benefit from an intervention.
“Trends in High School Dropout and Completion Rates in the United States: 2018”. Dropping out of high school has significant negative impacts on students. Statistically, they will have lower earnings than high school graduates, are more likely to be unemployed, have poorer health, and have a higher rate of incarceration. This report provides a detailed analysis of long-term dropout and completion trends and student characteristics of high school dropouts and completers. The first measure examined was the “event dropout rate” which is the percent of students who drop out in grades 10-12 without a high school diploma or alternative credential. The event dropout rate for SY 2015-16 was 4.8%, which translated into 532,000 students.
The 40 year trend show an alarming lack of progress. While 2015-16 was lower than in 1976 (5.8%), it reflects a worsening over the last ten years (increasing from 3.8% to 4.8%). Of all of the student demographic data, the clearest impact was that of family income. Students from the lowest income families had a 7.2% dropout rate compared to 3.9% for highest income families. The “adjusted cohort graduation rate” for 2015-16 was 84% which showed steady improvement over the past five years. The main problem is the significant differences in graduate rates across race, economic status, states, and disabilities. For example, graduation rates for white students ranged from 76% in New Mexico to 94% in New Jersey; black students from 57% in Nevada to 88% in West Virginia; Hispanic students from 65% in Minnesota to 89 % in Vermont.
Citation:
McFarland, J., Cui, J., Rathbun, A., and Holmes, J. (2018). Trends in High School Dropout and Completion Rates in the United States: 2018 (NCES 2019-117). U.S. Department of Education. Washington, DC: National Center for Education Statistics. Retrieved December 14, 2018 from http://nces.ed.gov/pubsearch.