NATIONAL ACHIEVEMENT TESTS
National Achievement Tests PDF
Keyworth, R., (2020). Overview of National Achievement Tests. Oakland, CA: The Wing Institute. https://www.winginstitute.org/student-national-standarized-tests.
Table of Contents
- Reading, Math, Science and Civics for ALL STUDENTS
- Reading and Math LONG TERM TRENDS
- NAEP: Reading: Long Term Scale Scores (ages 9, 13, 17) from 1971—2012
- NAEP: Reading and Math Proficiency Levels by Top/Bottom Ten States (2019)
- NAEP: Reading and Math Proficiency Levels by Top/Bottom Five Cities (TUDA)
- NAEP: READING Proficiency by Ethnicity (2019, 2015)
- White—Hispanic / White—Black Student Reading Proficiency Gap
- NAEP: READING Proficiency by Ethnicity (2019, 2015)
- White—Hispanic / White—Black Student Reading Proficiency Gap
An effective education system requires ongoing, meaningful and accurate feedback data for evaluating education performance at a macro level (system performance at different units of scale, i.e., school, district, state, and nation) to provide a foundation for informing policies, system interventions, and reform measures, as well sheds light on our performance in the areas of participation, quality, equity, and efficiency.
Benchmarking is a key element of measuring education performance. It involves identifying the best critical performance indicators, and comparing the results to standards and across various aspects of an education system. Without such indicators, it is impossible to evaluate the effectiveness of our education system or make sound decisions about school reform initiatives.
Standardized Tests are among the best tools for providing overall student performance data for large groups of students across demographics, schools, and states.
The National Education Assessment Progress (NAEP) has often been called the gold standard for standardized academic testing because of its constant rigorous scrutiny. It tests 4th, 8th and 12th grade students in reading and math every two years, and a wide range of other subjects less frequently. NAEP reports student performance by three achievement levels, or benchmarks: “Advanced” represents superior performance, “proficient” represents solid academic performance, and “basic” denotes partial mastery of prerequisite knowledge and skills fundamental for proficient work at each grade. NAEP also reports data on students who are “below basic.”
PERFORMANCE RESULTS: Reading, Math, Science and Civics for ALL STUDENTS
An unacceptably low percentage of students are at or above proficient in core subject areas. As of 2019, only 37% of 12th grade students are proficient in reading, 25% in math, 22% in science, and 24% in civics. Scores for the other two tested grades (4th and 8th) are comparably low.
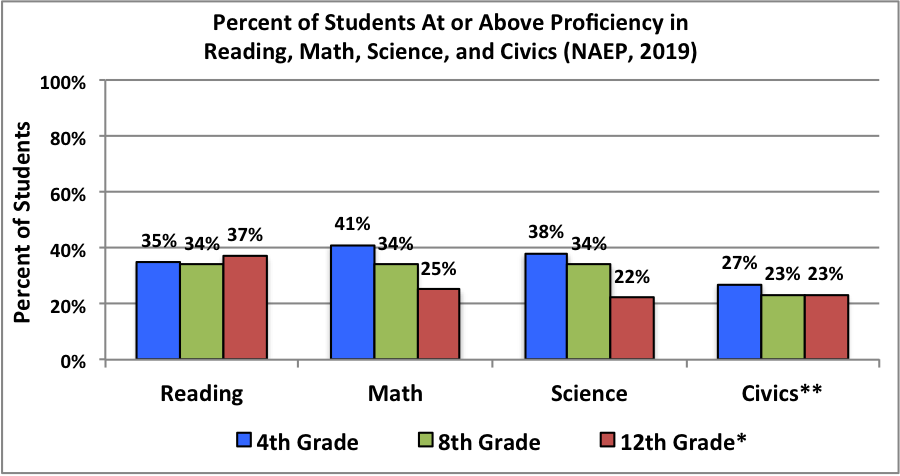
Figure 1. NAEP: Percent of students at or above proficiency in reading, math, science, civics (NAEP, 2019)
PERFORMANCE RESULTS: Reading and Math LONG TERM TRENDS
Despite numerous nation-wide school reform efforts, reading and math scores have remained virtually the same over the last 48 years (reading) and 41 years (math) respectively.
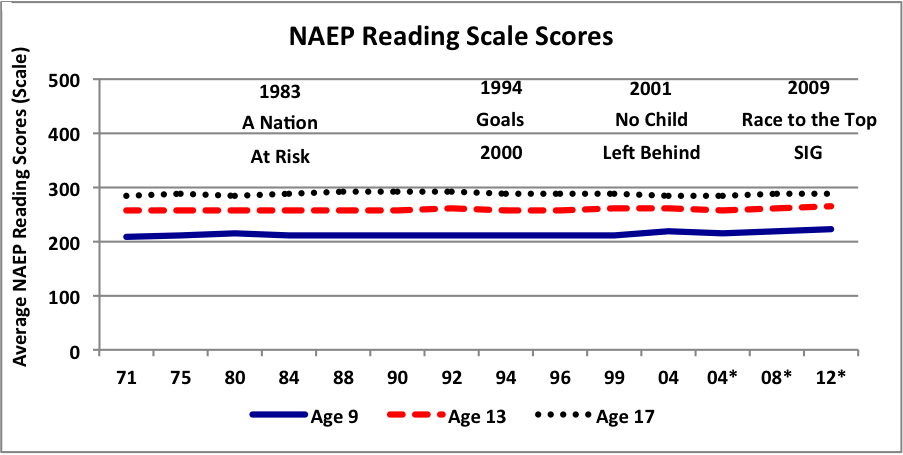
Figure 2. NAEP: Reading: Long Term Scale Scores (ages 9, 13, 17) from 1971—2012
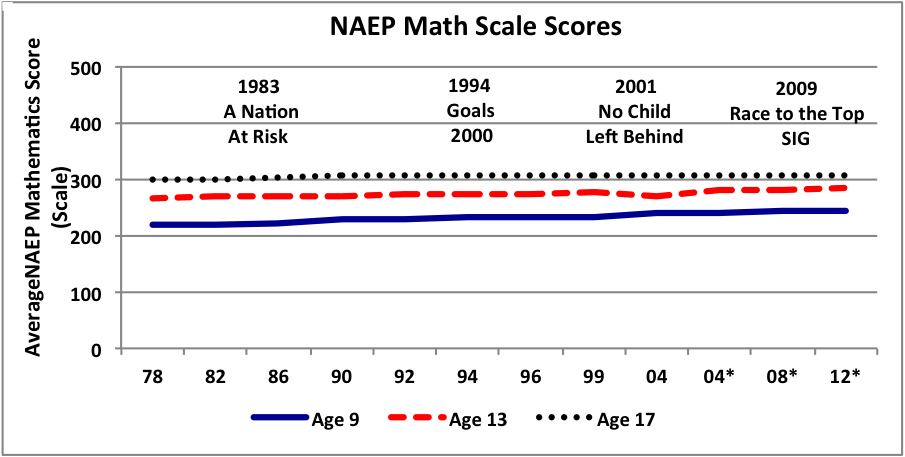
Figure 3. NAEP: Math Long Term Scale Scores (ages 9, 13, 17) from 1978—2012
PERFORMANCE RESULTS: Reading and Math by LOCALITY (States and Cities)
State NAEP scores vary widely. The following table averages the proficiency data across fourth and eighth grade reading and math scores. It lists the ten states with the highest performance, and ten with the poorest performance.
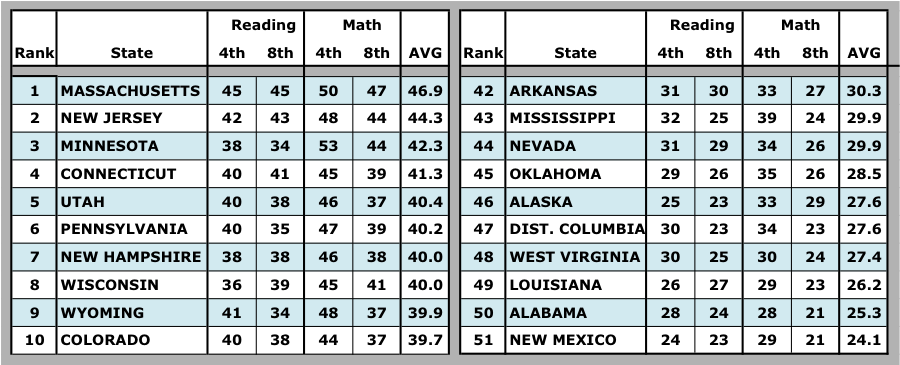
Table 1. NAEP: Reading and Math Proficiency Levels by Top/Bottom Ten States (2019)
Massachusetts had the highest aggregate score with 46.9 % of its 4th and 8th grade students being proficient in reading and math. The remaining top tier states averaged from 39.7 to 44.3 percent. Even the scores of the top ten states are unacceptable as they portray systems where half or more of the students are not at proficiency levels in reading and math. The ten poorest performing states had proficiency scores in the 20% range, with New Mexico having the lowest percentage of 24.1%.
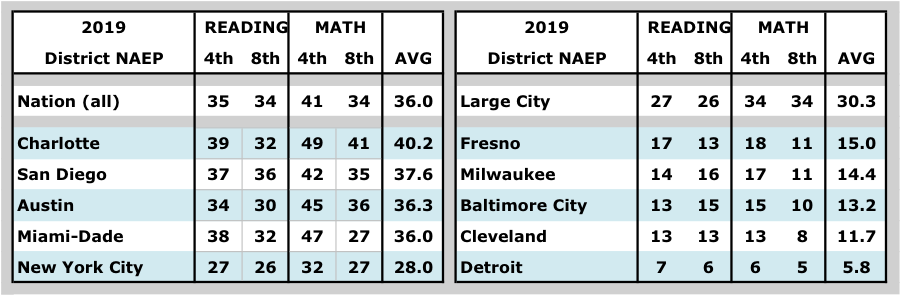
Table 2. NAEP: Reading and Math Proficiency Levels by Top/Bottom Five Cities (TUDA)
City NAEP scores also vary widely. Overall the scores of major cities were lower than the national average (28.3 proficiency versus 35.8%). But at the individual city level, some of the scores are staggeringly bad. Philadelphia, Shelby County, Fresno, Milwaukee, Baltimore, and Cleveland all have proficiency levels under twenty percent. Only 5.2% of the 4th and 8th grade students in Detroit are at or above proficiency in reading and math.
PERFORMANCE RESULTS: Reading Proficiency by Student ETHNICITY
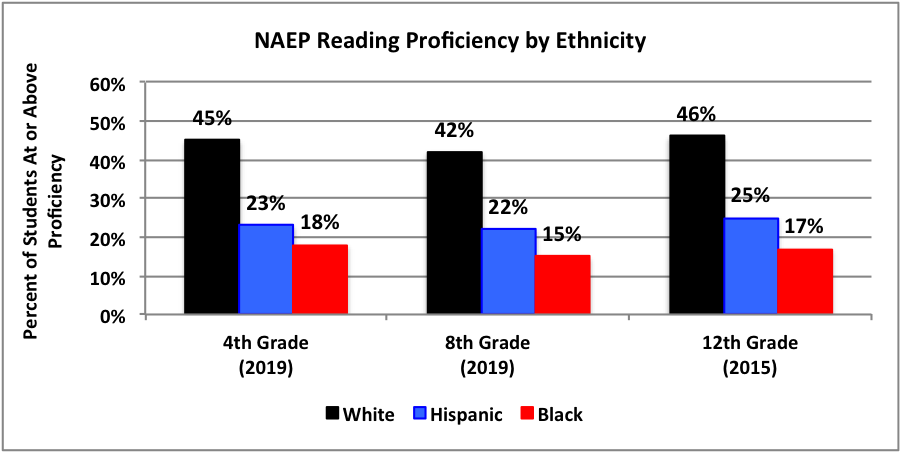
Figure 4. NAEP: READING Proficiency by Ethnicity (2019, 2015)
- PERFORMANCE: By 12th grade, less than half (46%) of all white students can read at a proficiency level. Proficiency percentages drop significantly for Hispanic students (25%) and Black students (17%).
- TRENDS: These 12th grade proficiency levels have not changed in almost 30 years. In 1992 the results showed White students 47% proficient, Hispanic students 23%, and Black students 18%.
PERFORMANCE RESULTS: Student Reading PROFICIENCY GAPS by Ethnicity
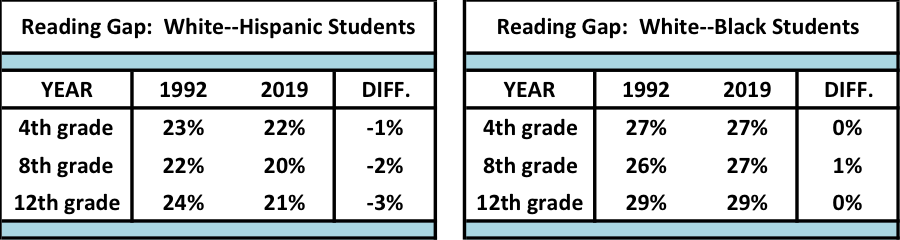
Table 3. White—Hispanic / White—Black Student Reading Proficiency Gap
- GAPS: The most recent performance gap between White and Hispanic 12th grade students is 21%; for White students and Black students it is 29%.
- TRENDS: These gaps have also remained virtually identical to those in 1992. The gap at that time between White and Hispanic students was 24%, and 29% for Black students.
PERFORMANCE RESULTS: Math Proficiency by Student ETHNICITY
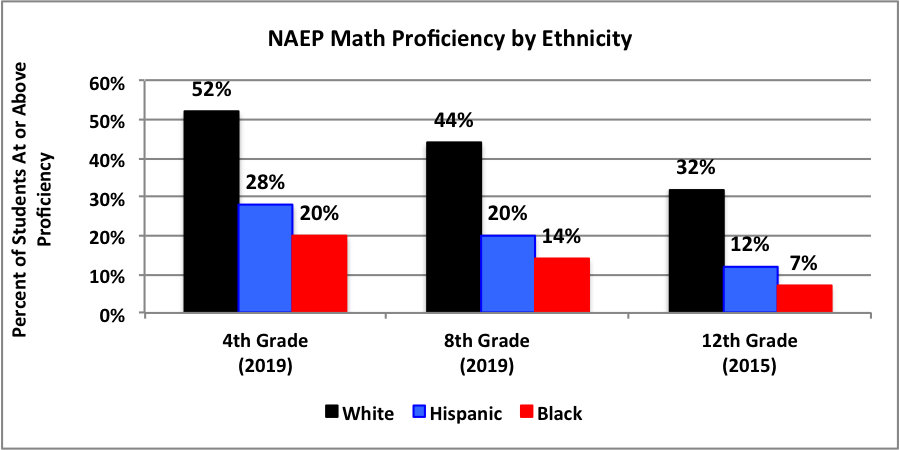
Figure 5. NAEP: MATH Proficiency by Ethnicity (2019, 2015)
- PERFORMANCE: By twelfth grade, less than one third (32%) of all white students are at or above proficiency level in math. Proficiency percentages drop significantly for Hispanic students (12%) and Black students (7%).
- TRENDS: These proficiency levels have not changed significantly since the test was overhauled fifteen years ago. In 2005 the results showed White students 29% proficient, Hispanic students 8%, and Black students 5%.
PERFORMANCE RESULTS: Student Math PROFICIENCY GAPS by Ethnicity
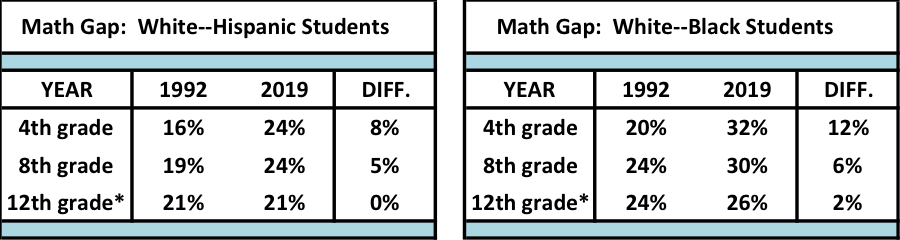
Table 4. White—Hispanic / White—Black Student Math Proficiency Gap
- GAPS: The most recent performance gap between 12th grade White students and Hispanic students is 21%; for White students and Black students it is 29%.
- TRENDS: These gapss have also remained virtually identical to those in 1992. The Gap between White students and Hispanic students was 24%, and 29% for Black students.
No items found.
TITLE
SYNOPSIS
CITATION
LINK
What Does the Research Say About Testing?
Since the passage of the No Child Left Behind Act (NCLB) in 2002 and its 2015 update, the Every Student Succeeds Act (ESSA), every third through eighth grader in U.S. public schools now takes tests calibrated to state standards, with the aggregate results made public. In a study of the nation’s largest urban school districts, students took an average of 112 standardized tests between pre-K and grade 12.
Berwick, C. (2019). What Does the Research Say About Testing? Marin County, CA: Edutopia.
The promise and pitfalls of using imprecise school accountability measures
In recent years, most states have constructed elaborate accountability systems using school-level test scores. We evaluate the implications for school accountability systems. For instance, rewards or sanctions for schools with scores at either extreme primarily affect small schools and provide weak incentives to large ones.
Kane, T. J., & Staiger, D. O. (2002). The promise and pitfalls of using imprecise school accountability measures. Journal of Economic perspectives, 16(4), 91-114.
NEPC Review: “Student Assessment During COVID-19.”
School closings and the ever-increasing number of deaths provide the backdrop for a proposal by the Center for American Progress (CAP) to deny waivers of the federally mandated administration of standardized tests in spring 2021. Further, the federal government proposes to add to those assessments in ways that CAP argues would make the test results more useful.
Mathis, W. J., Berliner, D. C., & Glass, G. V. NEPC Review: Student Assessment During COVID-19 (Center for American Progress, September 2020).
Contexts that matter for teaching and learning: Strategic opportunities for meeting the nation’s educational goals
The national education goals express a systemic approach to reform which fosters coherence in the disparate elements of the education system. This report highlights the findings of research conducted by the Center for Research on the Context of Secondary School Teaching (CRC) in California and Michigan during the years 1987-1992 and the implications for policy strategies to achieve the national education goals.
McLaughlin, M. W., & Talbert, J. E. (1993). Contexts that matter for teaching and learning: Strategic opportunities for meeting the nation's educational goals.
A field of IEP dreams: Increasing general education teacher participation in the IEP development process
As special education professionals, we sometimes feel we are working in a field of dreams. This field of dreams is created by idealistic visionaries, who develop legislation, regulations, and mandates that we must put into practice in actual school settings with limited time and resources.
Menlove, R. R., Hudson, P. J., & Suter, D. (2001). A field of IEP dreams increasing general education teacher participation in the IEP Development Process. Teaching Exceptional Children, 33(5), 28-33.
Nation’s report card
How did U.S. students perform on the most recent assessments? Select a jurisdiction and a result to see how students performed on the latest NAEP assessments.
National Assessment of Education Progress (NAEP). (2020) Nation’s report card. Washington, DC: National Center for Education Statistics, Institute of Education Sciences, U.S. Department of Education
Science and engineering indicators.
The Every Students Succeeds Act (ESSA) provided states with newfound flexibility on accountability measures and school improvement strategies. Many policy experts have analyzed states’ ESSA plans, which explain how states use their federal funds under various provisions of the new law, as well as the approaches states take to identify and rate schools and improve their performance where needed.
National Science Board. (2019, September 24). Science and engineering indicators. Public school teacher salaries (dollars).
Defining reflection: Another look at John Dewey and reflective thinking
Thinking, particularly reflective thinking or inquiry, is essential to both teachers’ and students’ learning. In the past 10 to 15 years numerous commissions, boards, and foundations as well as states and local school districts have identified reflection/inquiry as a standard toward which all teachers and students must strive.
Rodgers, C. (2002). Defining reflection: Another look at John Dewey and reflective thinking. Teachers college record, 104(4), 842-866.
It looks like the beginning of the end of America’s obsession with student standardized testing
America has been obsessed with student standardized tests for nearly 20 years. Now it looks like the country is at the beginning of the end of our high-stakes testing mania — both for K-12 “accountability” purposes and in college admissions.
Strauss, V. (2020). It looks like the beginning of the end of America’s obsession with student standardized tests. The Washington Post.
Calls are growing for Biden to do what DeVos did: Let states skip annual standardized tests this spring.
There are growing calls from across the political spectrum for the federal government to allow states to skip giving students federally mandated standardized tests in spring 2021 — but the man that President-elect Joe Biden tapped to be education secretary has indicated support for giving them.
Strauss, V. (2020b, December 30). Calls are growing for Biden to do what DeVos did: Let states skip annual standardized tests this spring. The Washington Post.
What you need to know about standardized testing
What you need to know about standardized testing.
Strauss, V. (2021, February 1). What you need to know about standardized testing. The Washington Post.
Is high-stakes testing working?
Test-based accountability systems — the use of tests to hold individuals or institutions responsible for performance and to reward achievement — have become the cornerstone of U.S. federal education policy, and the past decade has witnessed a widespread adoption of test-based accountability systems in the U.S. Consider just one material manifestation of this burgeoning trend: test sales have grown from from approximately $260 million annually in 1997 to approximately $700 million today — nearly a threefold increase.
Supovitz, J. (2021) Is high-stakes testing working? University of Pennsylvania, Graduate School of Education.
Back-to-school metrics: How to assess conditions for teaching and learning and to measure student progress during the COVID-19 pandemic.
The continuing COVID-19 pandemic has forced school districts across the nation to quickly adapt their approach to teaching and learning, with widespread variation in the response. With a new school year now underway, several states require that schools provide some degree of in-person instruction, while other states have left such decisions up to local education and public health officials.
Therriault, S. B. (2020). Back-to-school metrics: How to assess conditions for teaching and learning and to measure student progress during the COVID-19 pandemic. Regional Education Laboratory Program (REL).
Academic performance of New Jersey’s public school children: Fourth and eighth grade mathematics in 1992
Data from the 1992 National Assessment of Educational Progress are used to compare the performance of New Jersey public school children with those from other participating states. The comparisons are made with the raw means scores and after standardizing all state scores to a common (National U.S.) demographic mixture. It is argued that for most plausible questions about the performance of public schools the standardized scores are more useful.
Wainer, H. (1994). Academic Performance of New Jersey's Public Schools. education policy analysis archives, 2, 10.
Professional learning in the learning profession: A status report on teacher development in the U.S. and abroad
This report synthesizes what research says works in improving teacher skills and knowledge, what nations that outperform the United States in education are doing, and provides an analysis of newly available data from the federal Schools and Staffing Survey and other sources to indicate where the nation stands in building the capacity of educators to help students reach high standards. It includes newly analyzed data from the federal Schools and Staffing Survey and other data sources.
Wei, R. C., Darling-Hammond, L., Andree, A., Richardson, N., & Orphanos, S. (2009). Professional Learning in the Learning Profession: A Status Report on Teacher Development in the US and Abroad. Technical Report. National Staff Development Council.
Assessing student performance: Exploring the purpose and limits of testing.
In this book, Grant P. Wiggins clarifies the limits of testing in an assessment system. Beginning with the premise that student assessment should improve performance, not just audit it, Wiggins analyzes some time-honored but morally and intellectually problematic practices in test design, such as the use of secrecy, distracters, scoring on a curve, and formats that allow for no explanation by students of their answers.
Wiggins, G. P. (1993). Assessing student performance: Exploring the purpose and limits of testing. Jossey-Bass.