How do school characteristics correspond to violence levels?
Why is the question important? Students, parents, school leaders, law enforcement agencies, and policy-makers all need to understand where school crime occurs to make informed decisions. Millions of dollars are spent each year on programs and facilities to keep children safe at school. By understanding what school characteristics are related to school crime, these dollars can be more effectively invested where and how needed.
See further discussion below.
Violent Incidents Reported by Principal
(Rate per 1,000 Students)
 |
 |
 |
 |
 |
 |
Source: Indicators of School Crime and Safety: 2009, National Center for Education Statistics, Institute for Education Sciences, Bureau of Justice Statistics
Results: This study of the 2007-08 school year supports some widely accepted beliefs regarding school crime as well as presenting some surprising results. It is important to note that while these results show correlation between some school characteristics and the rate of violent incidents, they do not show causation.
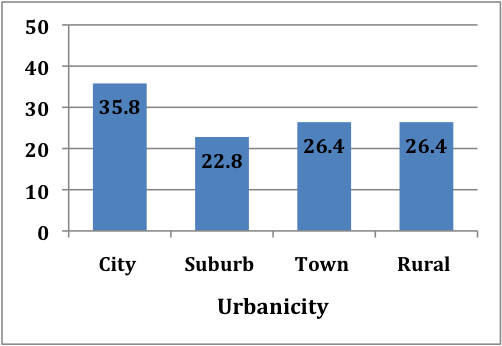
It is widely believed that crime occurs more frequently in urban schools, which is supported by this study. Principals of schools classified as ‘City’ report 35.8 violent incidents per 1,000 students as compared to those from schools classified as (Suburb) reporting 22.8 incidents per 1,000 students.
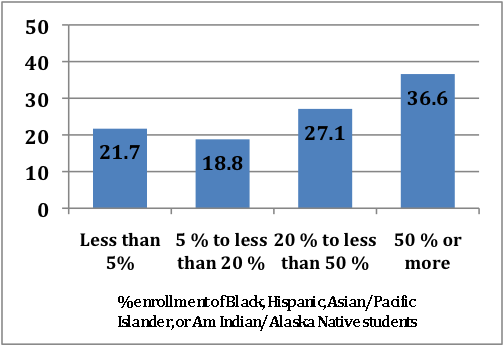
Also, many believe that schools with a higher percentage of ‘minority’ (Black, Hispanic, Asian/Pacific Islander, and American Indian/Alaska Native) students have higher rates of crime. This study bears this out with schools with between 5 and 20 percent minority students reporting 18.8 incidents per 1,000 students versus those with 50% or more minority students reporting 36.6 incidents per 1,000 students. Interestingly, schools with less than 5% minority report a higher rate of violent incidents (21.7 per 1,000 students) than those with 5 to 20%. Does some racial diversity help temper a school environment?
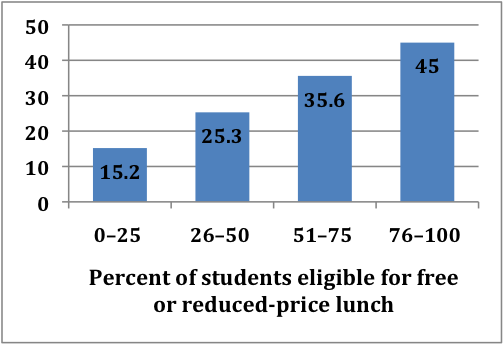
A third widely held belief is the correlation between poverty and violence. This study supports this theory in the school environment. Principals at schools where zero to 25 percent of students are eligible for free or reduced-price lunch report 15.2 violent incidents per 1,000 students, while those at schools where 76 to 100 percent of students are eligible report 45 incidents per 1,000 students.
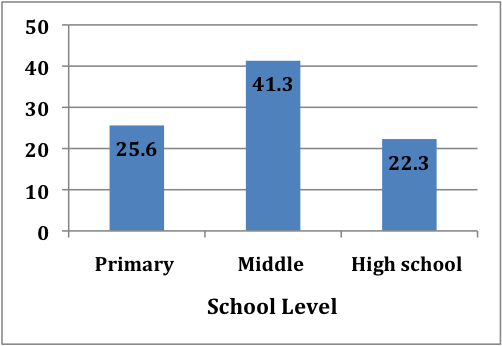
Particularly surprising results show that middle schools are the most dangerous of the schools studied. Middle school principals report 41.5 violent incidents per 1,000 students, while primary and high school principals report 25.6 and 22.3 incidents per 1,000 students. Are middle school-age youth really more violent than high school-age youth? Are violent middle-schoolers culled from student ranks by the time they reach high school age?
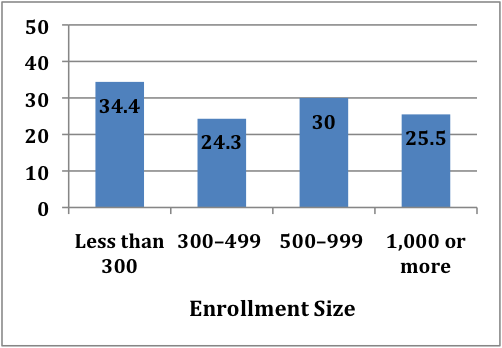
Another surprising result undermines the commonly-held belief that small schools are safe schools. While principals at large schools – those with 1,000 or more students – report an average violent incident rate of 25.5 per 1,000 students, principals at small schools – with less than 300 students – report 34.4 incidents per 1,000 students. Do smaller schools really have more violence with all other things being equal or is there some other characteristic that links small size to more violence? For example, if special education schools tend to be smaller and these students exhibit more violent behavior due to their disabilities.
Implications: This study challenges some commonly accepted notions about schools and crime, but also supports some of these. Clearly small schools, in themselves, are not the safest environment, but observers need to look more closely to better understand violence in small schools. Similiarly, those considering middle school and high school violence levels need to look beyond simply school grade levels to interpret the data. High violence levels in urban schools provide further support for this problem and should help focus resources there to better understand and improve the situation. Likewise, poverty is a key indicator of school violence and attention must be given to resolve this issue.
Authors: Dinkes, Rachel, and Jana Kemp, Katrina Baum, Thomas Snyder
Publisher: Bureau of Justice Statistics, Office of Justice Programs, U.S. Department of Justice
Study Description: Data were collected by survey from school principals or the person most knowledgeable about crime and safety issues at the school as part of the U.S. Department of Education, National Center for Education Statistics, 2007-2008 School Survey on Crime and Safety (SSOCS), 2008.
Definitions:
1. Violent Incidents: include serious violent incidents; physical attack or fight without a weapon; and threat of physical attack without a weapon.
2. Primary School: schools in which the lowest grade is not higher than grade 3 and the highest grade is not higher than grade 8.
3. Middle School: schools in which the lowest grade is not lower than grade 4 and the highest grade is not higher than grade 9.
4. High School: schools in which the lowest grade is not lower than grade 9.
5. Student/teacher Ratio: calculated by dividing the total number of students enrolled in the school by the total number of full-time-equivalent (FTE) teachers and aides. The total number of FTE teachers and aides is a combination of full-time and part-time teachers and aides, including special education teachers and aides, with an adjustment for part-time status.
6. At school: includes activities that happen in school buildings, on school grounds, on school buses, and at places that hold school-sponsored events or activities. Occurances before, during, or after normal school hours or when school activities or events were in session.
Citation: Bureau of Justice Statistics; Web site: http://bjs.ojp.usdoj.gov/content/pub/pdf/iscs09.pdf