Have NAEP math scores improved over the past 40 years of school reform?
Why is this question important? The education system needs to measure critical outcomes to determine whether or not school reforms work in such critical areas as math. One of the most reliable testing instruments is the National Assessment of Educational Progress (NAEP) test. The NAEP provides an ongoing, representational, objective and quantitative data on what students know and can do.
See further discussion below.
Source: U.S. Department of Education, Institute of Education Sciences, National Center for Educational Statistics, NAEP Data Explorer. http://nces.ed.gov/nationsreportcard/naepdata/
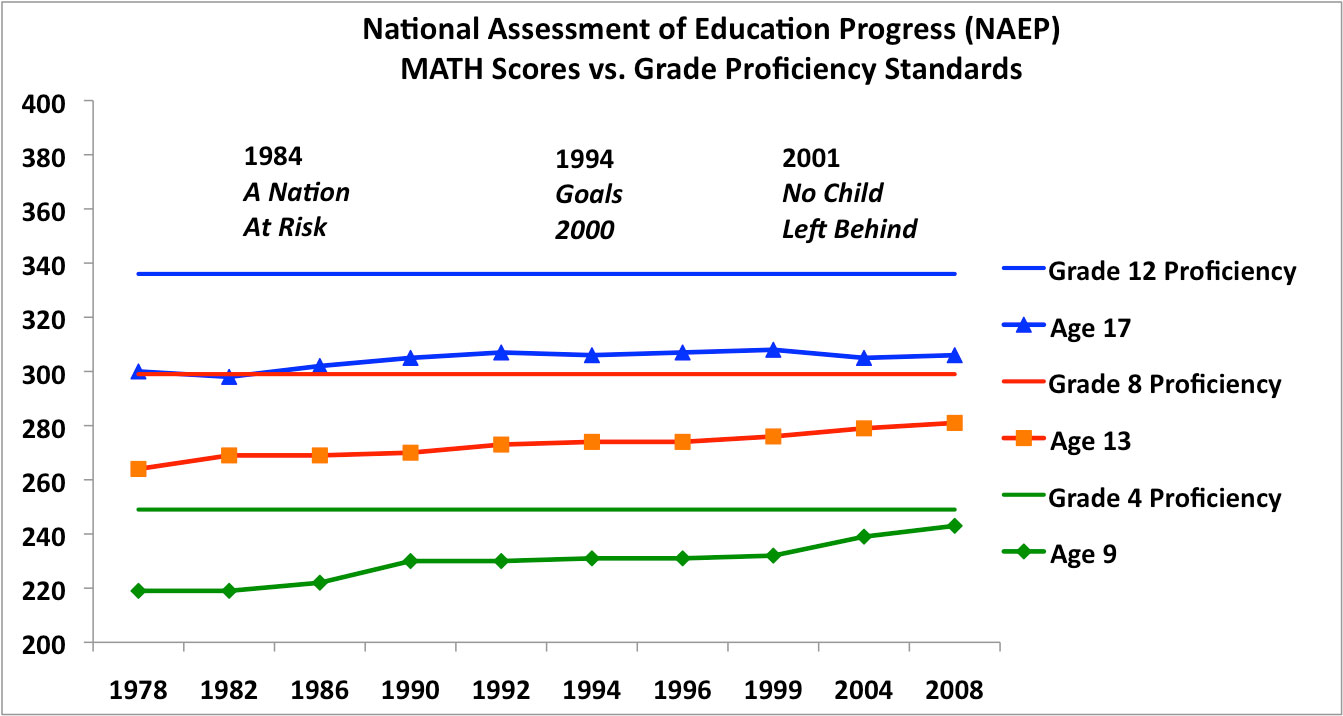
Results: The data shows that there has been a gain in math scores for fourth graders. Their average scores in 2008 were 243, which is near the proficiency cuts score of 249. Eighth grade scores have risen consistently over the forty year period, but are still well below proficiency. Their scores in 2008 were 281, against a proficiency cut score of 299. The least improvement in math scores is in the twelfth grade, where scores haven’t changed much over the forty years and are well below proficiency.
Implications: This data suggests that forty years of school reform, initiatives, spending, etc. have had limited impact on math scores. While the math scores for younger students (fourth grade) have improved, this improvement diminishes by eighth grade and disappears by age twelfth grade. The fact that this absence of success has continued for 40 years is extremely problematic. The implications are that the education system needs to significantly modify its strategies, adopt data systems to track outcomes in relation to interventions, and invest in research to determine what does and does not produce desired outcomes.
Authors: None
Publisher: U.S. Department of Education, Institute of Education Sciences, National Center for Educational Statistics, NAEP Data Explorer
Study Description: The NAEP test is the only nationally representative and continuing assessment of what America’s students know and can do in: math, reading, science, writing, the arts, civics, economics, geography, and U.S. History. It provides a common metric for all states and a clear picture of student academic progress over time. The test stays the same each year with carefully documented changes. It is administered by National Center for Education Statistics (NCES) within the Institute of Education Sciences within the U.S. Department of Education. The tests are continually scrutinized for reliability and validity by panels of technical experts within NCES and by external groups.
Definitions:
Basic denotes partial mastery of prerequisite knowledge and skills that are fundamental for proficient work at each grade.
Proficient represents solid academic performance. Students reaching this level have demonstrated competency over challenging subject matter.
Advanced represents superior performance.
Grade 4
Basic = 214
Proficient = 249
Advanced = 282
Grade 8
Basic = 262
Proficient = 299
Advanced = 333
Grade 12
Basic = 288
Proficient = 336
Advanced = 367