Has student mathematics proficiency improved over the past 20+ years?
Why is this question important? A high-achieving education system must have in place processes to evaluate student performance regularly and over time. Additionally, it must have proficiency standards to identify skills that students should be able to demonstrate. Mathematics is one of the most important skills our education system teaches, and an enormous amount of time and energy has been invested over the past 22 years to improve student performance. Tracking performance over time allows stakeholders to gauge the overall success of American schools in teaching core curricula and to judge the impact of reform efforts.
To calibrate the National Assessment of Educational Progress (NAEP), the National Center for Education Statistics (NCES) secures recommendations from policymakers, educators, and members of the general public for specific achievement levels for each subject and grade. The following are benchmarks for student performance: Advanced represents superior performance, proficient represents solid academic performance, and basic denotes partial mastery of prerequisite knowledge and skills fundamental for proficient work at each grade. Proficiency becomes a critical benchmark because it is the level at which students have met the target standards for a subject area. (Gorman, 2010). It is also the benchmark by which No Child Left Behind (NCLB) holds school districts accountable (NCES, 2011c).
See further discussion below.
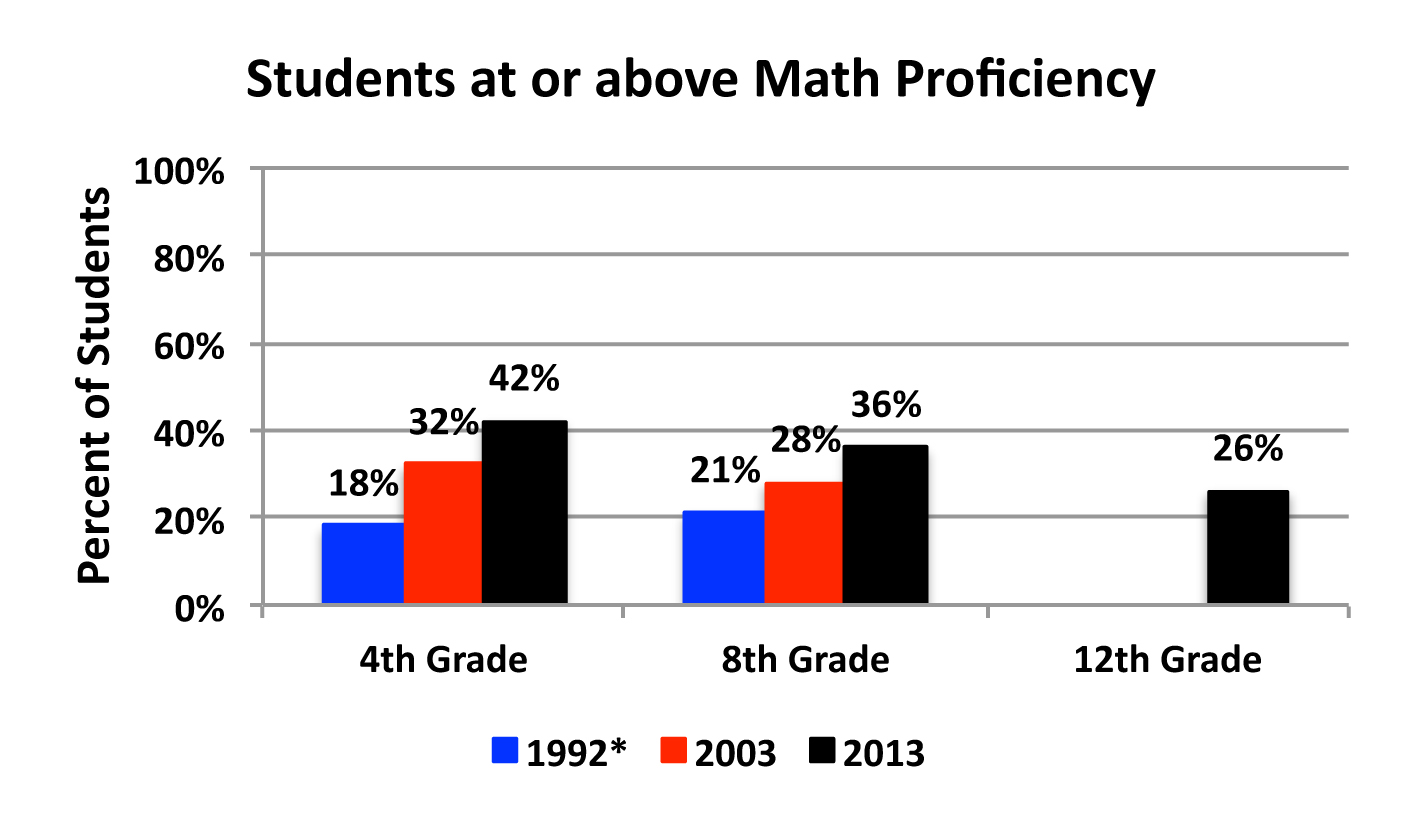
Figure 1: Percent of students at or above math proficiency.
Source: The Nation's Report Card. A First Look: 2013 Mathematics and Reading. Custom Data Table.
*Accommodations for disabilities were not permitted.
Results: The above graph displays mathematics proficiency scores for 4th and 8th graders in 3 selected years: 1992, 2003, and 2013. There is only one data point for 12th graders as the test was overhauled in 2005 and previous test scores would not be consistent. The data for 4th and 8th graders show steady progress over the 21-year period. The most significant finding is that, regardless of this progress, less than half of 4th and 8th graders (42% and 36% respectively) were at the mathematics proficiency level for their grade. Even more alarming is that in the most recent year, 2013, math proficiency dropped from 4th grade (42%) to 8th grade (26%) to 12th grade (26%). This drop is particularly worrisome given the significant resources that have been invested in school reform. The lack of progress is more evident when examining each grade's proficiency scores in detail.
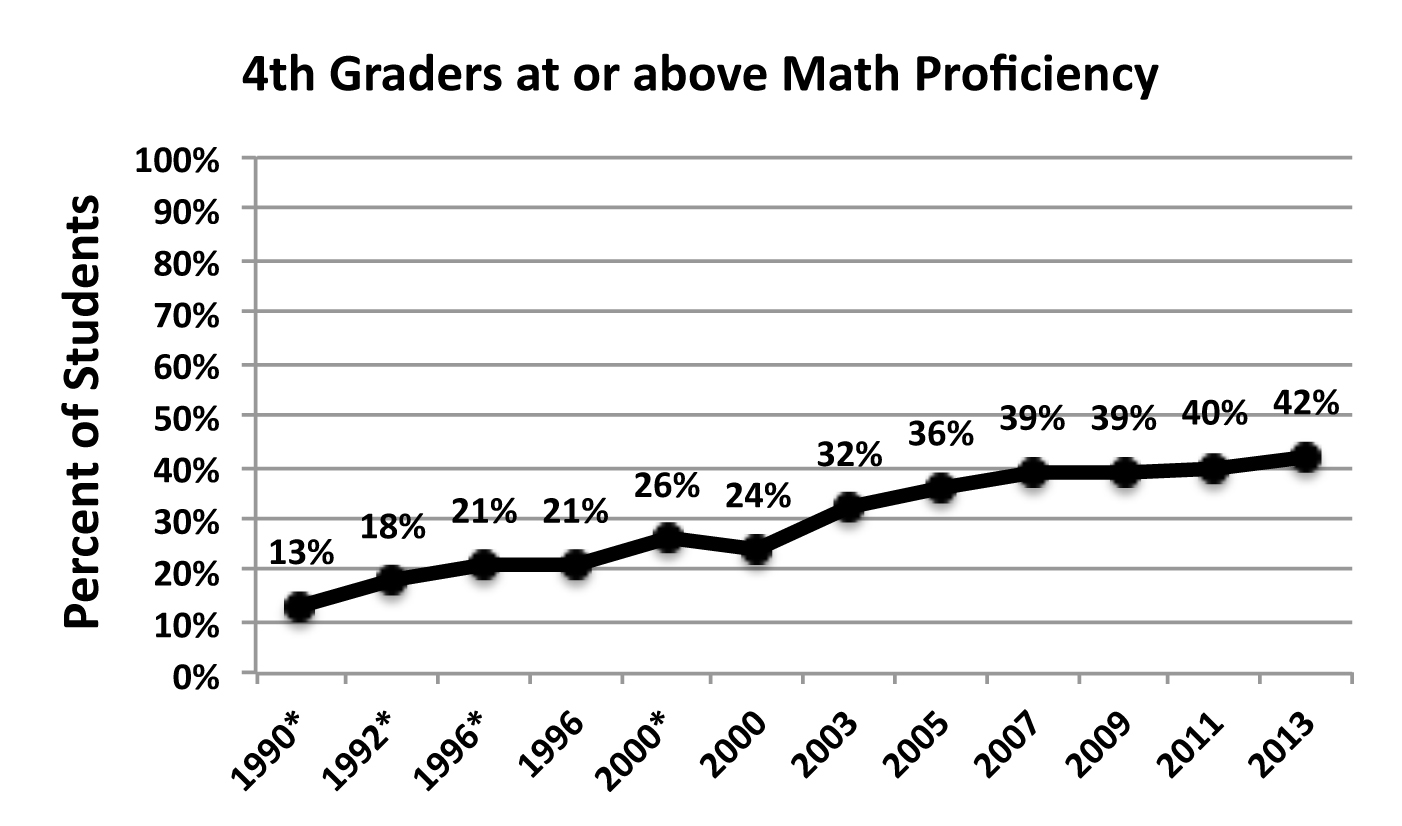
Figure 2. Percent of fourth graders at or above math proficiency.
Source: The Nation's Report Card. A First Look: 2013 Mathematics and Reading. Custom Data Table.
*Accommodations for students with disabilities were not permitted.
Math proficiency is one of the few areas where student performance has shown real growth, although the baseline proficiency was only 13%. The percentage of 4th graders at or above mathematics proficiency increased by 29 percentage points over the past 20+ years. However, the growth has flattened out beginning since 2007, despite perhaps the most significant school reform initiative in this country's history. And, as noted previously, any system that produces a proficiency rate of only 42% is problematic.
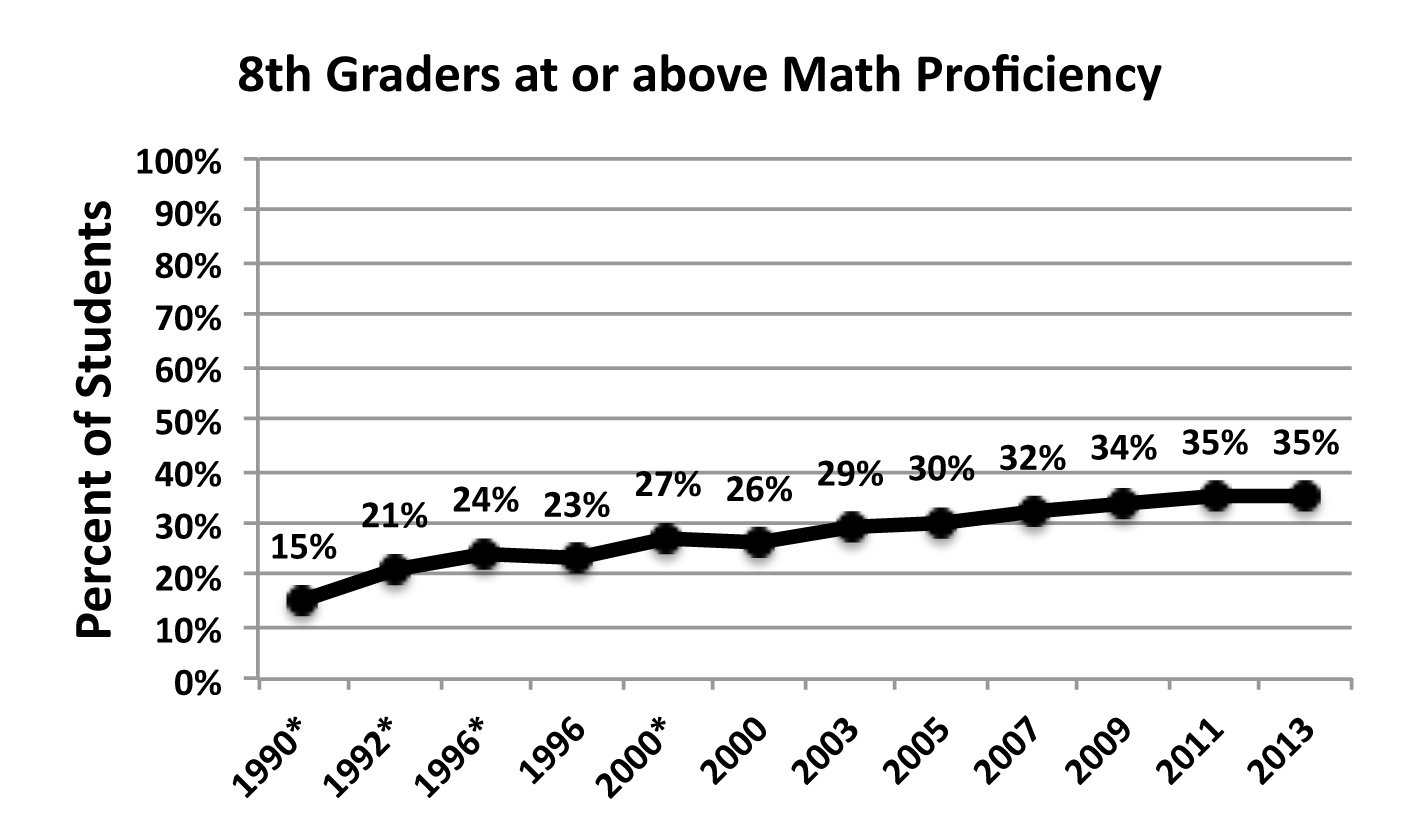
Figure 3. Percent of eighth graders at or above math proficiency.
Source: The Nation's Report Card. A First Look: 2013 Mathematics and Reading. Custom Data Table.
*Accommodations for students with disabilities were not permitted.
Data for 8th graders at or above mathematics proficiency follow the same pattern as for 4th graders. The 20% improvement since 1992 is significantly diminished given that the most recent data for proficiency is only 35%. Additionally, the improvement of just 3 percentage points since 1998 is extremely small.
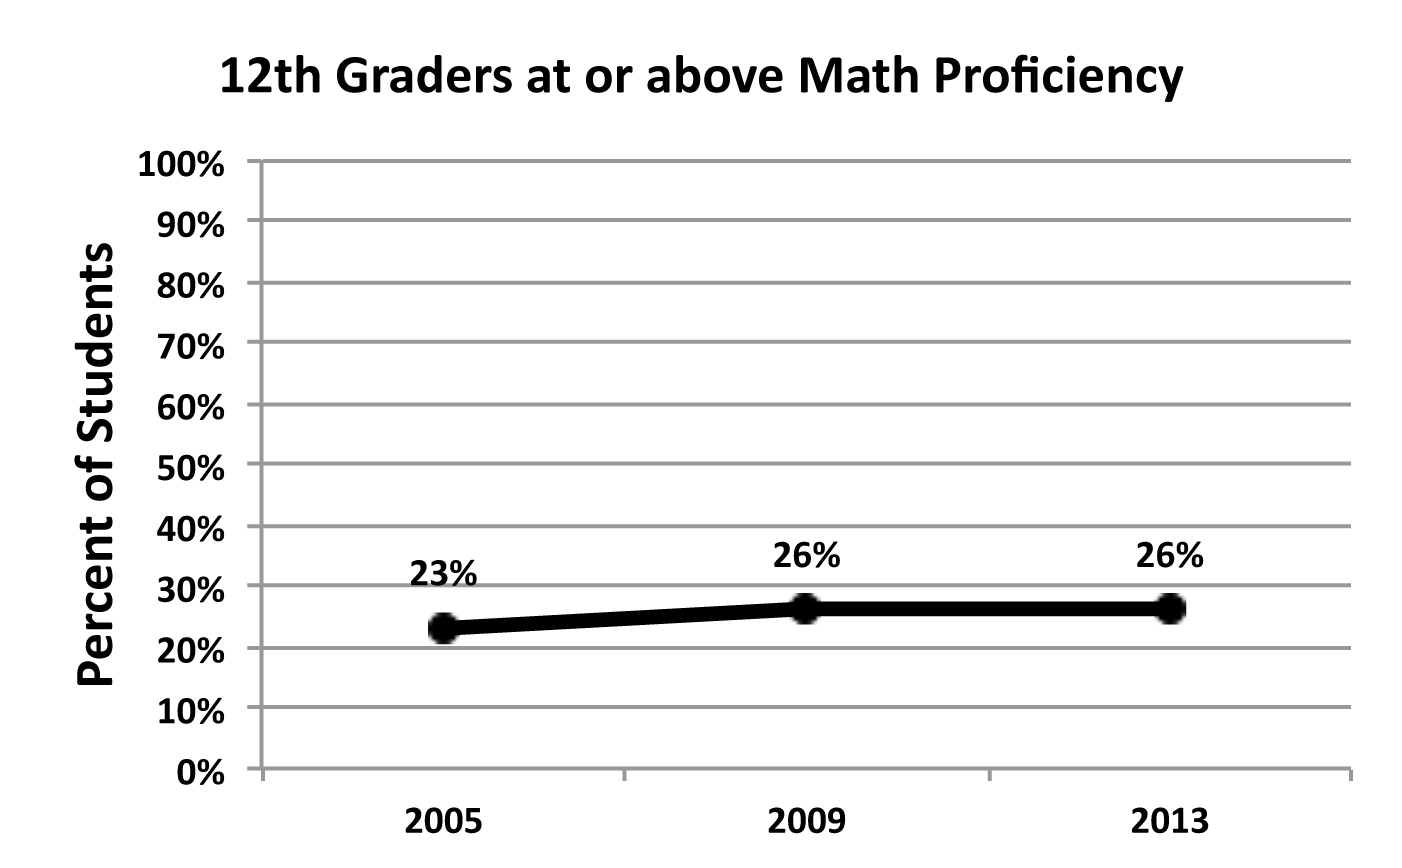
Figure 4. Percent of 12th graders at or above math proficiency.
Source: The Nation's Report Card. A First Look: 2013 Mathematics and Reading.
Custom Data Table.
The 12th grade mathematics proficiency data stand out for two reasons. First, there has been virtually no progress in proficiency scores over the past 8 years. Second, this represents the final data on how poorly our K–12 system has prepared students in mathematics. The fact that only 26% of graduating seniors in 2013 were proficient in mathematics is of great concern.
Implications: The value of a nation's education system is measured by how well it serves all of its children, not just those fortunate enough to attend a model school or live in a high-performing school district. While the NAEP achievement level assessment test is a macro-measure aggregating the performance of all students by age range, data from these tests provide a clear and unambiguous picture of how poorly the U.S. education system is educating students on selected content measures. The implications of these data must also be discussed at the macro level. The aggregate of all of the resources, initiatives, policies, and programs the United States has implemented for K–12 school reform has not had a corresponding impact on proficiency in mathematics. Barely more than a quarter of graduating seniors at or above proficiency is not an acceptable outcome for any education system.
Study Description: NAEP has often been called the gold standard for standardized academic testing because of its constant rigorous scrutiny (Gorman, 2010). Established in 1964, with the first tests administered in 1969, NAEP provides a continuing assessment of what American students know and can do in math, reading, science, writing, the arts, civics, economics, geography, and U.S. history. NAEP is administered by NCES, a division of the Institute of Education Sciences in the U.S. Department of Education. Panels of technical experts within NCES and other organizations continually scrutinize tests for reliability and validity, keeping them similar from year to year and documenting changes. NAEP is one of the few common metrics for all states, providing a picture of student academic progress over time.
The richest set of student achievement data come from NAEP, which provides data on subject matter achievement in two ways: scale scores (long-term trend assessment) and achievement levels (main NAEP assessment). The long-term trend assessment makes available test data in mathematics and reading going back to 1970, with test scores by age (9, 13, and 17). It is completed every 4 years. The main NAEP assessment reports test results on 12 different subject areas going back to 1992, with student data by grade (4, 8, and 12). It is completed every 2 years. For both assessments, probability samples of schools and students are selected to represent the diverse student population in the United States.
Citation:
Gardner, D. P., Larsen, Y. W., Baker, W. O., Campbell, A., Crosby, E. A., Foster, C. A., Jr., ...Wallace, R. (1983). A nation at risk: The imperative for educational reform. An open letter to the American people. A report to the nation and the secretary of education. Retrieved from http://www.eric.ed.gov/ERICWebPortal/detail?accno=ED226006.
Gorman, S. (2010). An introduction to NAEP. (NCES 2010-468). Washington, DC: National Center for Educational Statistics. Retrieved from http://nces.ed.gov/pubsearch/pubsinfo.asp?pubid=2010468.
National Center for Education Statistics (NCES). (2011c). The NAEP Glossary of Terms.
Retrieved from http://nces.ed.gov/nationsreportcard/glossary.asp#basic
National Center for Education Statistics (NCES). (2013). The nation's report card. A first look: 2013 mathematics and reading. Custom data table 4th grade reading. Retrieved from http://nces.ed.gov/nationsreportcard/naepdata/report.aspx?app=NDE&p=1-MAT-2-20133%2c20113%2c20093%2c20073%2c20053%2c20033%2c20003%2c20002%2c19963%2c19962%2c19922%2c19902-MRPCM-TOTAL-NT-ALC_BB%2cALC_AB%2cALC_AP%2cALC_AD-Y_J-0-0-37.
National Center for Education Statistics (NCES). (2013). The nation's report card. A first look: 2013 mathematics and reading. Custom data table 8th grade reading. Retrieved from http://nces.ed.gov/nationsreportcard/naepdata/report.aspx?app=NDE&p=2-MAT-2-20133%2c20113%2c20093%2c20073%2c20053%2c20033%2c20003%2c20002%2c19963%2c19962%2c19922%2c19902-MRPCM-TOTAL-NT-ALC_BB%2cALC_AB%2cALC_AP%2cALC_AD-Y_J-0-0-37.
National Center for Education Statistics (NCES). (2013). The nation's report card. A first look: 2013 mathematics and reading. Custom data table 12th grade reading. Retrieved from http://nces.ed.gov/nationsreportcard/naepdata/report.aspx?app=NDE&p=3-MAT-3-20133%2c20093%2c20053-MWPCM-TOTAL-NT-ALC_BB%2cALC_AB%2cALC_AP%2cALC_AD-Y_J-0-0-5.
Organisation for Economic Cooperation and Development (OECD). (2012). Education at a Glance 2012: OECD Indicators. OECD Publishing. doi:10.1787/eag-2012-en.