How does math proficiency correlate with a student's socio-economic status?
Why is this question important? The value of a nation's education system is measured by how well it serves all of its children, not just those fortunate enough to attend a model school or live in a high-performing school district. One of the more important student categories is socio-economic status, especially as the percentage of students from low-income families is growing. A recent report from the Southern Education Foundation (2015) documents that, for the first time in recent history, the majority of children attending public schools come from low-income families. The data also show a steady growth in this trend over the past 25 years: 32% of students were from low-income families in 1980; 38% in 2000; 42% in 2006; 48% in 2011; and 51% in 2013. It is critical that the education system track and evaluate how well students from low-income families perform, the trend of this performance, and the gap between low- and high-income student performance.
To calibrate the National Assessment of Educational Progress (NAEP), the National Center for Education Statistics (NCES) secures recommendations from policymakers, educators, and members of the general public to set specific achievement levels for each subject and grade. The following are benchmarks for student performance: Advanced represents superior performance, proficient represents solid academic performance, and basic denotes partial mastery of prerequisite knowledge and skills fundamental for proficient work at each grade. Proficiency becomes a critical benchmark because it is the level at which students have met the target standards for a subject area. (Gorman, 2010). It is also the benchmark by which No Child Left Behind (NCLB) holds school districts accountable.
NAEP achievement scores can also be disaggregated by socio-economic status. One way of identifying a student's socio-economic background is whether or not the student qualifies for the National School Lunch Program (NSLP). Children may qualify for either free or reduced-price lunch based on family income. Free lunch eligibility represents the lowest income families.
See further discussion below.
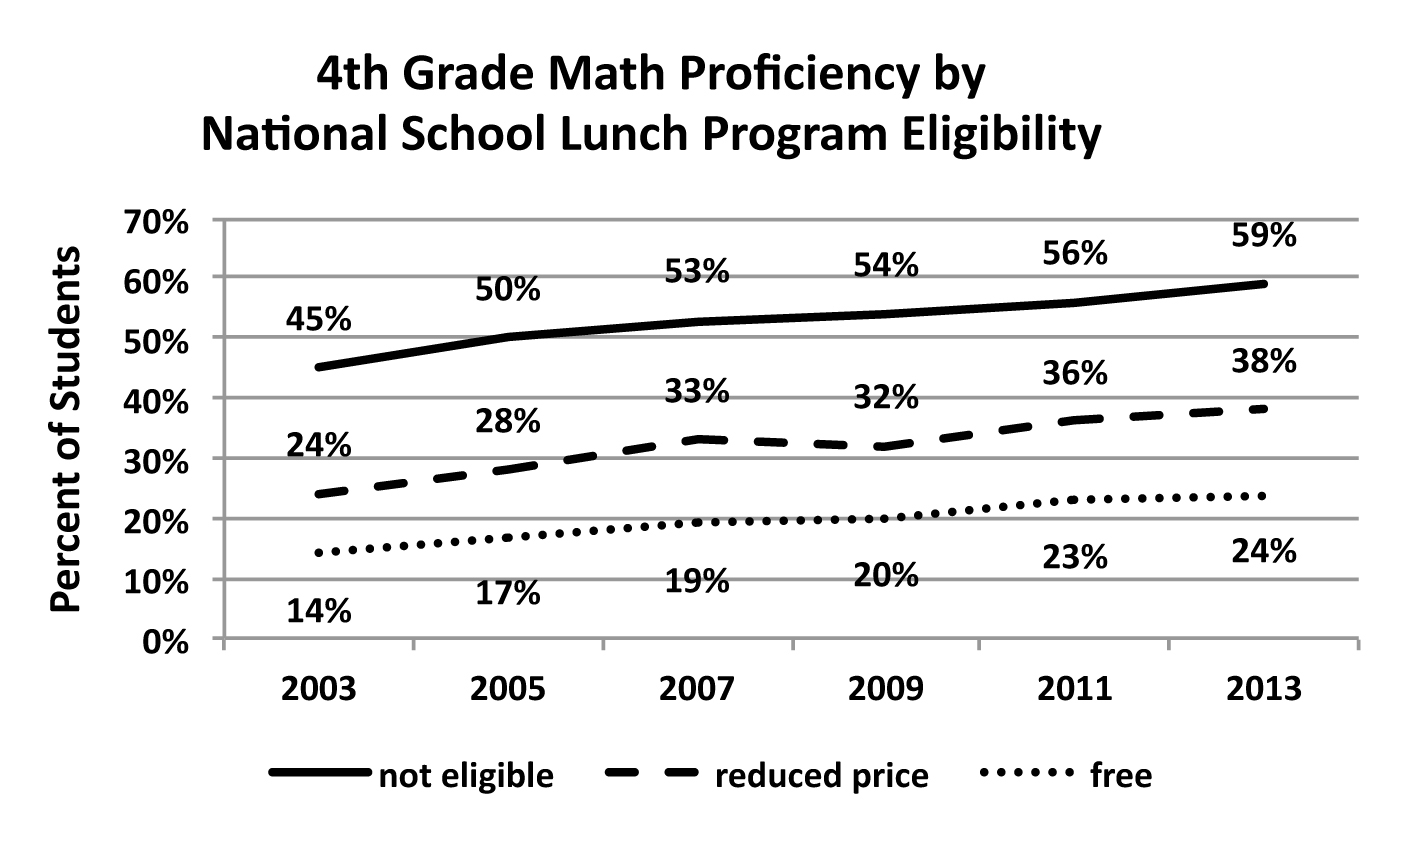
Figure 1. 4th grade math proficiency by national school lunch program eligibility.
Source: The Nation's Report Card, A First Look: 2013 Mathematics and Reading
Custom Data Table.
Results: Figure 1 displays math proficiency scores for 4th grade students by family income. Students not eligible for NSLP represent the highest family incomes, students who qualify for reduced price lunch come from families of lower income, and students who qualify for free lunch represent the lowest family incomes. The data show several patterns.
The most recent data on math proficiency (2013) show a distinct gap in performance that correlates with students' family income. While 59% of 4th grade students from higher income families read at proficiency, only 38% of students from lower income families achieved proficiency. Students from the lowest income families were at an extremely low proficiency rate of 24%. This pattern is present for the entire 10-year period.
The math proficiency rate improved over the 10-year period. The rate of improvement was the same for students from families with higher incomes as it was for students from families with lower incomes (14 percentage points). The lowest income students improved by only 10 percentage points.
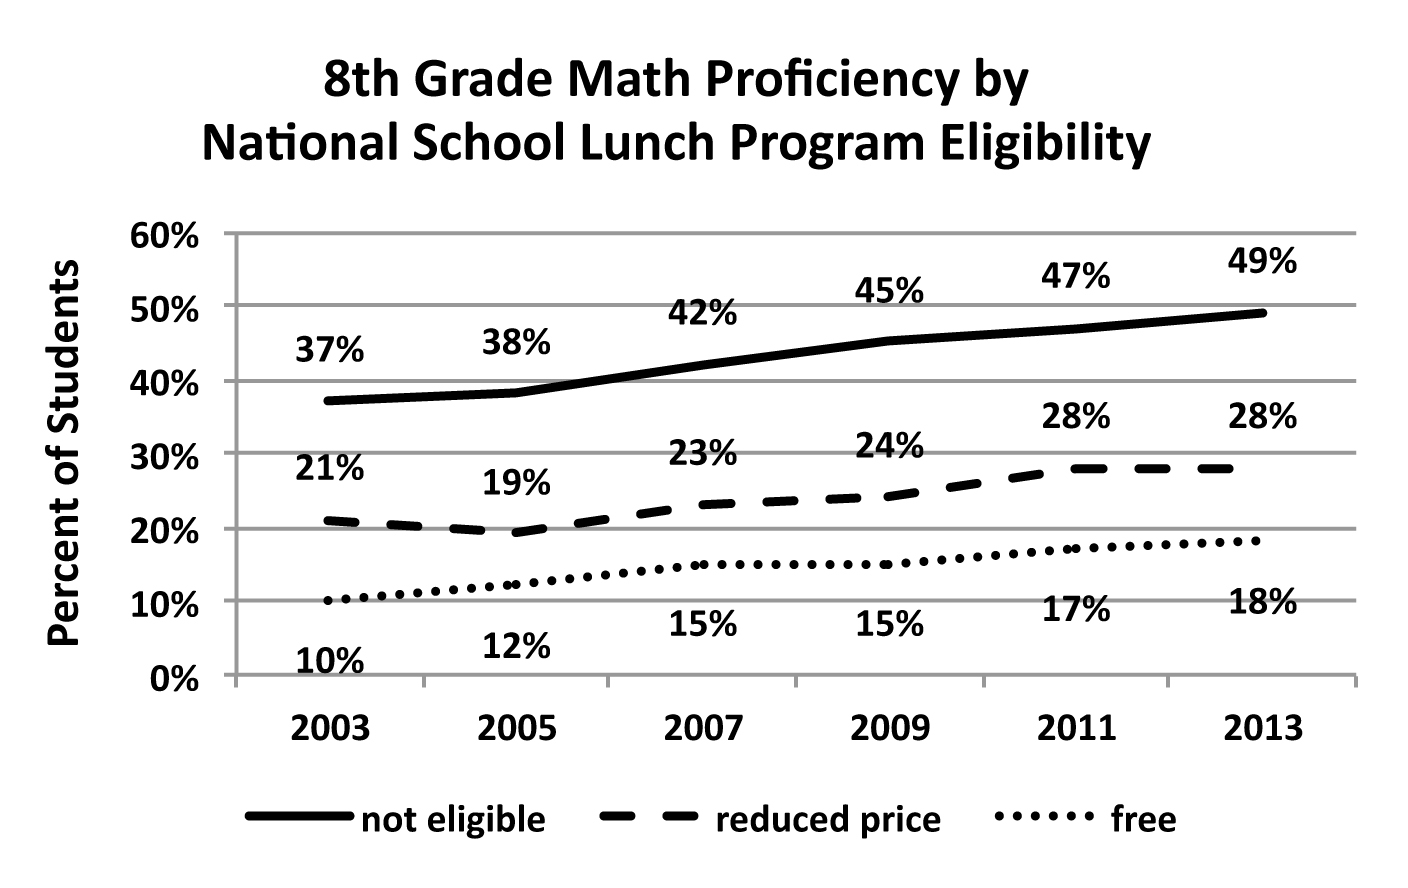
Figure 2. 8th grade math proficiency by national school lunch program eligibility.
Source: The Nation's Report Card, A First Look: 2013 Mathematics and Reading
Custom Data Table.
Figure 2 displays math proficiency scores for 8th grade students by family income. The data show the same patterns as for 4th graders. Math proficiency and improvement in math proficiency over time are highly correlated with a student's family income. In 2013, 49% of 8th grade students from higher income families were proficient in math as opposed to 28% of lower income students and 18% of the lowest income students. The math proficiency of the highest income students increased by 12 percentage points over the 10-year period versus 7 percentage points for lower income students and 8 percentage points for the lowest income students.
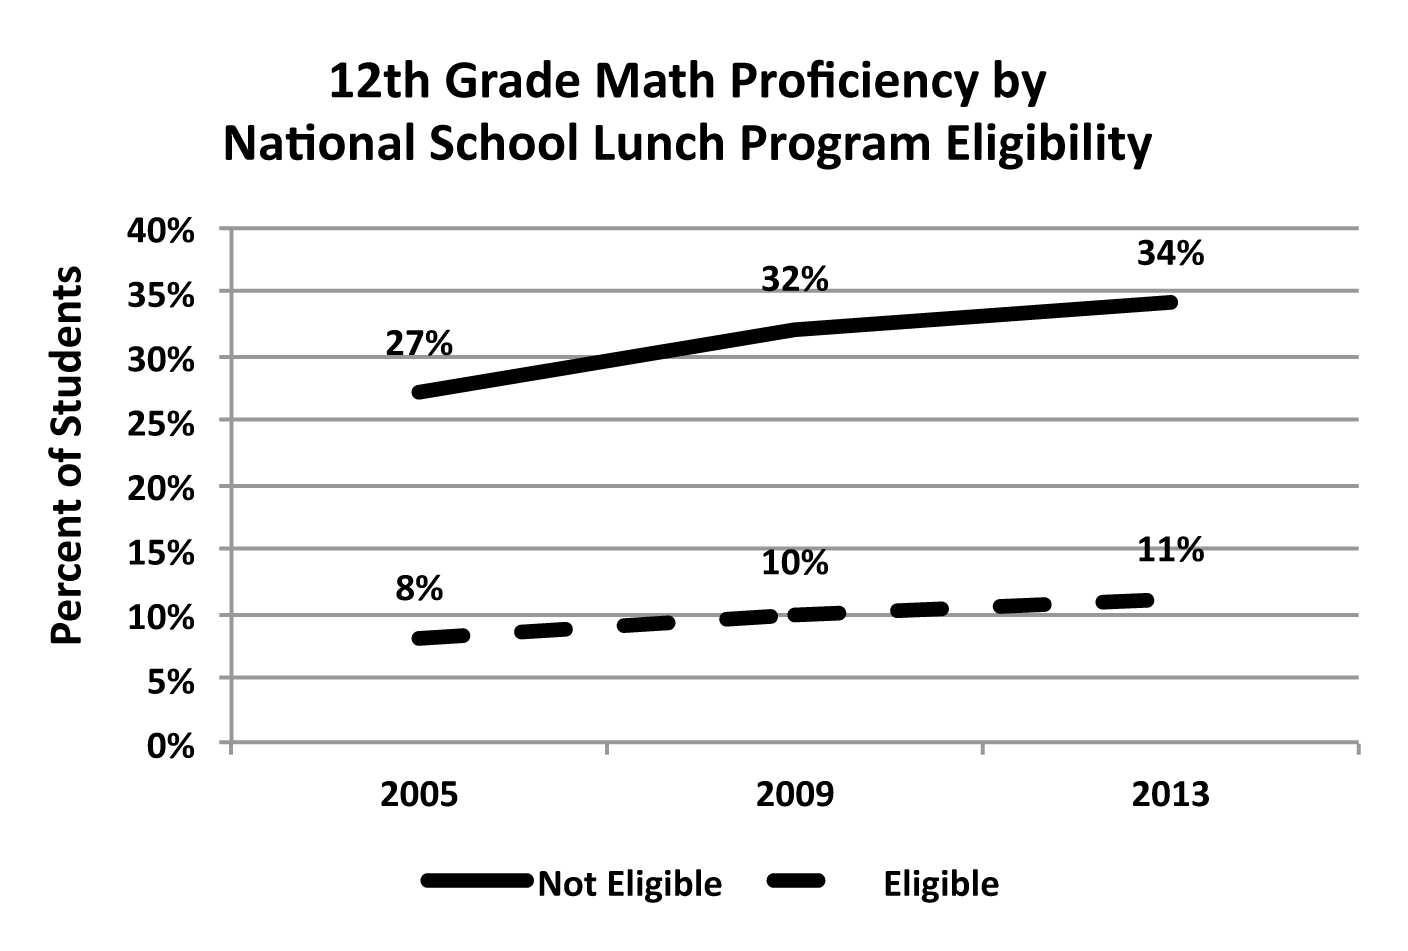
Figure 3. 12th grade math proficiency by national school lunch program eligibility.
Source: Data Retrieved from Data Explorer for Main NAEP, NCES.
NSLP data for 12th grade students are available only from 2005 onward, as the math test was significantly modified that year. Also, data are available for only two categories of students: those eligible for reduce price or free lunch and those not eligible. The trend from the 4th and 8th grades continue through the 12th grade. In 2013, 34% of higher income students (those not eligible) were proficient in mathematics. Only 11% of lower income students (those eligible) were at or above proficiency level. The trend over the graphed period showed the same pattern. Higher income students' proficiency improved by 7 percentage points versus an improvement of just 3 percentage points for lower income students.
One of the objectives of school reform initiatives is to close this gap in performance between students of different socio-economic status. Figure 4 examines this gap between the highest and lowest income students in for both 4th and 8th grades.
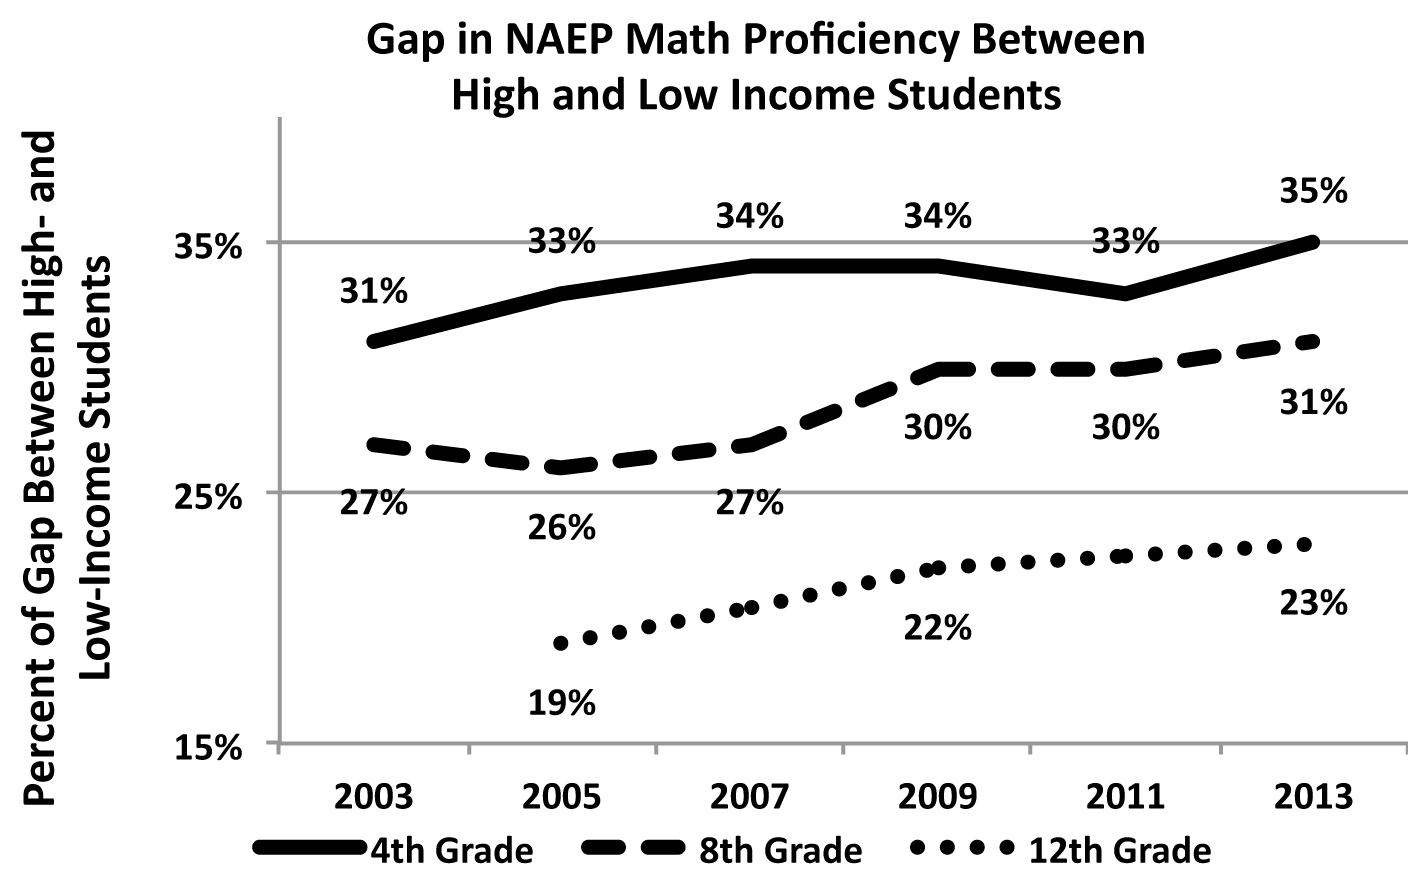
Figure 4. Math proficiency gap between high- and low-income students.
Sources: The Nation's Report Card, A First Look: 2013 Mathematics and Reading
Custom Data Table; Data Retrieved from Data Explorer for Main NAEP, NCES.
The data in Figure 4 show a large and increasing gap in math proficiency between students from high-income families and those from low-income families. In 2013, the gap for 4th graders was 35%, an increase of 4 percentage points over the 10-year period. During the same year, the gap for 8th grade student was 31%, an increase of 4 percentage points over the 10-year period. The gap for 12th graders was 23%, an increase of 4 percentage points since 2005.
Across all grades, students from families with higher incomes continue to be more proficient in math than students from lower income families. The improvement over time among students from higher income families is greater than among students from lower income families, resulting in an increasing gap between the two groups. The bottom line: In the current education system, the lower a student's family income is, the poorer the student's math performance.
Implications: Education is increasingly referred to as the civil rights issue of our generation. Few social institutions have more impact on the health and well-being of a nation's citizenry. As a culture, we hold the assumption, codified in federal and state laws, that all students have access to an equal and effective education. Yet NAEP data suggest that this isn't true when it comes to a student's socio-economic status. The percentage of students performing math at proficiency level in 4th, 8th, and 12th grades varies according to family income, with poorer students much less proficient. The fact that the gap is growing wider suggests an even larger problem, as more than half of the students in public K–12 schools are now from low-income families and typically perform worse on NAEP tests.
Study Description: NAEP has often been called the gold standard for standardized academic testing because of its constant rigorous scrutiny (Gorman, 2010). Established in 1964, with the first tests administered in 1969, NAEP provides a continuing assessment of what American students know and can do in math, reading, science, writing, the arts, civics, economics, geography, and U.S. history. NAEP is administered by NCES, a division of the Institute of Education Sciences in the U.S. Department of Education. Panels of technical experts within NCES and other organizations continually scrutinize tests for reliability and validity, keeping them similar from year to year and documenting changes. NAEP is one of the few common metrics for all states, providing a picture of student academic progress over time.
The richest set of student achievement data come from NAEP, which provides data on subject matter achievement in two ways: scale scores (long-term trend assessment) and achievement levels (main NAEP assessment). The long-term trend assessment makes available test data in mathematics and reading going back to 1970, with test scores by age (9, 13, and 17). The main NAEP assessment reports test results on 12 different subject areas going back to 1992, with student data by grade (4, 8, and 12).
Citation:
Gardner, D. P., Larsen, Y. W., Baker, W. O., Campbell, A., Crosby, E. A., Foster, C. A., Jr., ...Wallace, R. (1983). A nation at risk: The imperative for educational reform. An open letter to the American people. A report to the nation and the secretary of education. Retrieved from http://www.eric.ed.gov/ERICWebPortal/detail?accno=ED226006.
Gorman, S. (2010). An introduction to NAEP. (NCES 2010-468). Washington, DC: Institute of Education Sciences, National Center for Education Statistics. Retrieved from http://nces.ed.gov/pubsearch/pubsinfo.asp?pubid=2010468.
National Center for Education Statistics (NCES). (2013). The nation's report card. A first look: 2013 mathematics and reading. Custom data table 4th grade math. Retrieved from
http://nces.ed.gov/nationsreportcard/naepdata/report.aspx?app=NDE&p=1-RED-2-20133%2c20113%2c20093%2c20073%2c20053%2c20033%2c20023%2c20003%2c20002%2c19983%2c19982%2c19942%2c19922-RRPCM-TOTAL-NT-ALC_BB%2cALC_AB%2cALC_AP%2cALC_AD-Y_J-0-0-37.
National Center for Education Statistics (NCES). (2013). The nation's report card. A first look: 2013 mathematics and reading. Custom data table 8th grade math. Retrieved from http://nces.ed.gov/nationsreportcard/naepdata/report.aspx?app=NDE&p=2-RED-2-2013 3%2c20113%2c20093%2c20073%2c20053%2c20033%2c20023%2c20003%2c20002%2c19983%2c19982%2c19942%2c19922-RRPCM-TOTAL-NT-ALC_BB%2cALC_AB%2cALC_AP%2cALC_AD-Y_J-0-0-37.
National Center for Education Statistics (NCES). (2013). The nation's report card. A first look: 2013 mathematics and reading. Custom data table 12th grade reading. Retrieved from
http://nces.ed.gov/nationsreportcard/naepdata/report.aspx?app=NDE&p=3-RED-2-20133%2c20093%2c20053%2c20023%2c19983%2c19982%2c19942%2c19922-RRPCM-TOTAL-NT-ALC_BB%2cALC_AB%2cALC_AP%2cALC_AD-Y_J-0-0-5.
National Center for Education Statistics (NCES). (2011f). Data Explorer for main NAEP. [Data file]. Washington, DC: National Center for Educational Statistics, Retrieved from http://nces.ed.gov/nationsreportcard/naepdata/dataset.aspx.
Southern Education Foundation (2015). A new majority: Low income students now a majority in the nation's public schools. Retrieved from http://www.southerneducation.org/getattachment/4ac62e27-5260-47a5-9d02-14896ec3a531/A-New-Majority-2015-Update-Low-Income-Students-Now.aspx.