Use Implementation Science to bridge the Research-to-Practice Gap
March 24, 2026
Wing Institute Newsletter March 2026
|
|||||||||||||||||||||||||||||||||||||||||||||||||||||||||||||||||||||||||||||||||||||||||||||||||||||||||||||||||||||||||||||||||||||||||||||||||||||||||||||||||||||||||||||||||||||||||||||||||||||||||||||||||||||||||||||||||||||||||||||||||||||||||||||||||||||||||||||||||||||||||||||||||||||||||||||||||||||||||||||||||||||||||||||||||||||||||||||||||||||||||||||||||||||||||||||||||||||||||||||||||||||||||||||||||||||||||||||||||||||||||||||||||||||||||||||||||||||||||||||||||||||||||||||||||||||||||||||||||||||||||||


March 24, 2026
|
|||||||||||||||||||||||||||||||||||||||||||||||||||||||||||||||||||||||||||||||||||||||||||||||||||||||||||||||||||||||||||||||||||||||||||||||||||||||||||||||||||||||||||||||||||||||||||||||||||||||||||||||||||||||||||||||||||||||||||||||||||||||||||||||||||||||||||||||||||||||||||||||||||||||||||||||||||||||||||||||||||||||||||||||||||||||||||||||||||||||||||||||||||||||||||||||||||||||||||||||||||||||||||||||||||||||||||||||||||||||||||||||||||||||||||||||||||||||||||||||||||||||||||||||||||||||||||||||||||||||||||
December 16, 2025
“[Executive function] is comprised of a set of skills – working memory, inhibitory control, and cognitive flexibility – that contribute to goal directed behaviors (Carlson, Zelazo, & Faja, 2012)”
Schmitt et al. (2025)
Dr. Sara A. Schmitt and her co-authors recently published the results of a study on the relationships between English Learner (EL) status and preschool math and spatial skills. The authors also explored whether these relationships were impacted by the level of executive function (EF) skills in the participants.
Executive function skills have been found to predict math and spatial skills in children from low-income families1–2. Schmitt and her colleagues noted that based on prior research, EF might also play a protective role for EL students and students from low-income backgrounds.
For example, an EL student from a low income background who has high EF skills might have stronger academic outcomes than if they had lower EF skills.
When Schmitt et al. compared the El and non-EL student groups, they found that EL students scored significantly lower than non-EL students on measures of cardinality and numeral identification when controlling for demographic and language variables. The authors also found a statistically significant interaction between EL status and EF level when predicting numeracy ability, but the interaction was only significant for students with high EF skills.
Specifically, the authors found that the difference between EL and non-EL students in numeracy ability was significant when both groups of students had high executive function skills. When both groups had lower executive function skills, the difference in numeracy ability between EL and non-EL students was not significant.
EL students were found overall to have lower math language skills than non-EL students, i.e. there was no interaction with EF, even though EF explained a significant amount of variance in this domain.
EL students with high and low EF skills had lower math language skills than non-EL students.
The authors found no relation between EL status and spatial skills, although EF explained a significant amount of variance in spatial skills.
EF is an important part of spatial ability, but appeared to affect EL and non-EL students in this study similarly.
Overall, Schmitt et al.’s finding that EL students have a disadvantage compared to non-EL peers in early math skills is aligned with previous research in this area. Interestingly, Schmitt et al., did not find evidence that EF served as a protective factor for EL students on measures of math related skills. The authors also did not find evidence that EL students had an advantage, compared to non-EL peers, on certain aspects of EF such as inhibitory control and spatial skills. Schmitt et al., considered that their results may contradict previous research results in these areas due to measurement differences.
These findings add to the body of research about the relationship between EL status, EF skills, and early math performance.
“Ultimately, better understanding the connections between EF, math, and spatial skills by EL status may inform the design of early childhood instruction and intervention practice for EL children.”
Schmitt et al. (2025)
November 5, 2025
We’ve resumed posting new research and will be updating the website with tools, tips, and practical resources. We’re also reorganizing to meet the needs of our diverse audience in an effort to better bridge the research to practice gap.
In the meantime, check back often for new updates! Reach out to let us know how we can better serve your needs.
If you haven’t already read Dr. Janet Twyman’s article, “Re-Engineering the Educational System: Technology Transfer from a Behavioral Perspective,” published in Perspectives on Behavior Science earlier this year, check it out now!1
We’ve also linked to The Reading League (TRL) in our Evidence Based Curriculum and Best Available Evidence categories. This organization provides transparent and thorough reviews of widely used curricula, along with many other tools and resources for educators!
See an example of one of TRL’s Curriculum Navigation Reports here!2 This review, along with many others can be found on the Compass tab for Curriculum Decision Makers on TRL’s website.

October 13, 2022
Implementation integrity is one of the most critical features to ensure that evidence-based practices are effective. Educators are always in search of methods that will increase implementation integrity. One of the most researched approaches is performance feedback. Much less evaluated is the combination of goal setting and feedback. Criss and colleagues (2022) conducted a systematic review of the effects of goal setting combined with performance feedback. They identified 22 studies that met the inclusion criteria. Overall, the results suggest that goal setting, combined with performance feedback, was an efficacious method for increasing implementation integrity. Additionally, goal setting and feedback factors likely contributed to better outcomes.
Interestingly, teacher created goals resulted in better outcomes than when a consultant made the goals alone or when the teacher and consultant collaboratively developed goals. In most studies, goals were established during baseline. They produced moderate to large effect sizes in randomized clinical studies, and moderate success estimates in studies based on single case designs. Providing feedback on progress toward goals was most effective and closely followed by discussing goals during feedback. Setting goals during baseline with no further discussion resulted in the weakest effects.
Practices related to feedback that seemed to increase effectiveness were identified. Data presented visually yielded high success estimates in single case studies and moderate to large effect sizes in randomized clinical trials. Verbal feedback, written feedback, and emailed written feedback all produced more moderate effects but were still effective.
This review does not clearly show how much feedback contributed to these outcomes and how much goal setting was responsible for them. Regardless, educators can feel confident combining the two strategies can increase implementation integrity. The specific methods used for providing feedback will depend on the resources available. Ideally, feedback would be related to teacher-created goals with visual feedback for progress toward goals. Resources may not be available to meet individually with each teacher, so it may be necessary to send written and visual feedback to each of the teachers about their progress toward their goals.
Citation:
Criss, C. J., Konrad, M., Alber-Morgan, S. R., & Brock, M. E. (2022). A Systematic Review of Goal Setting and Performance Feedback to Improve Teacher Practice. Journal of Behavioral Education, 1-22.
Link for article:
https://link.springer.com/article/10.1007/s10864-022-09494-1
October 13, 2022
In the review above, we discussed the effectiveness of First Step Next. Based on the available evidence, it is an effective intervention for preschool through third grade students. The next question for school leaders is how cost-effective it is? In other words, how much do they pay for the obtained outcomes? School financial resources are limited, so educators must be cost-conscious. The next evolution in the evidence-based practice movement in education is conducting cost-effectiveness analysis. Regardless of effectiveness, if an intervention has a poor cost-benefit ratio, then it is not likely to be adopted. The authors of this study evaluated the cost-effectiveness of an efficacy study of First Step Next. Cost-effectiveness was calculated for the combined intervention of First Step Next and homeBase, First Step Next alone, and homeBase alone. Cost-effectiveness was evaluated for classified as ADHD, students classified Conduct Disorder, and those students with comorbid ADHD and Conduct Disorder. Treatment effectiveness was defined as movement from the clinical range into the borderline or normative range or from the borderline to the normative range post-intervention.
The combined intervention of First Step Next and homeBase was the most cost-effective. The combined package cost more to implement but produced a greater return on the investment than First Step Next alone or homeBase alone. First Step Next alone was the next most cost-effective, and homeBase was the least cost-effective. In terms of treating the clinical syndromes addressed in this study, it was most expensive to produce improvement in the comorbid condition of ADHD and Conduct Disorder, followed by Conduct Disorder, and then ADHD.
This study highlights the complexity of decision-making for school leaders. The combined package of First Step Next and homeBase is the most expensive intervention but produces the greatest return on investment. It is not always possible for school leaders to offer the multi-component intervention because parents may refuse to participate or district policies may prohibit home-based services. The school leaders will still achieve a reasonable return on their investment by offering First Step Next alone. Adding to the complexity of decision-making is the differential cost-effectiveness of the different clinical populations. School leaders will get the greatest return on investment for addressing ADHD. Providing First Step Next to address problems associated with the comorbid condition of ADHD and Conduct Disorder is more expensive, thus reducing the cost-benefit ratio. It may be that First Step Next is still more cost-effective than some other interventions developed to address this population. Comparisons with different treatments were not conducted in this analysis.
These data should be taken with a “grain of salt.” The data were derived from a large-scale efficacy study. These tend to be more expensive since researchers are so closely involved in the implementation of the intervention. Efficacy studies usually produce greater effects than when usual school resources implement an intervention. The outcomes would not be as strong, but the costs may be less, so the cost-benefit ratio may be approximately the same. These analyses are a welcome addition to the evidence base for specific interventions. It would be beneficial to have cost-effectiveness data for an intervention across different contexts and populations.
Citation:
Kuklinski, M. R., Small, J. W., Frey, A. J., Bills, K., & Forness, S. R. (2022). Cost Effectiveness of School and Home Interventions for Students with Disruptive Behavior Problems. Journal of Emotional and Behavioral Disorders, 10634266221120521.
Link to article:
https://journals-sagepub-com.dist.lib.usu.edu/doi/full/10.1177/10634266221120521
October 13, 2022
First Step Next is the current iteration of First Step to Success. It is designed to be an early elementary teacher-friendly intervention for students with disruptive behavior. Since 1998 it has been empirically evaluated to determine effectiveness giving us a large body of evidence to consider. The research methods have ranged from single case designs and quasi-experimental methods to randomized clinical trials. The authors of this synthesis reviewed only randomized clinical trials, generally considered the gold standard for research, that were conducted between 2009 and 2021. The review considered evidence from efficacy studies in which researchers were closely involved in the execution of the project, and effectiveness studies in which the researchers worked at “arm’s length” from the school and implementation was carried out by the existing personnel in the school. In addition, the researchers evaluated the effects of First Step Next alone and when combined with a home-based program, homeBase. Finally, the researchers assessed the impact of First Step Next on at-risk populations such as Attention Deficit Hyperactivity Disorder (ADHD, anxiety, and Autism Spectrum Disorder (ASD).
The synthesis suggests that First Step Next results in small to large effect sizes across different outcome measures. Efficacy studies produced larger effect sizes than effectiveness studies. It is generally the case that efficacy studies yield larger effects. The effects were more robust in school than at home, as measured by the teacher and parent reports. The results for the clinical populations of ASD, ADHD, and anxiety were comparable to the overall population of students in the studies.
This synthesis suggests that school leaders can expect to achieve positive outcomes when adopting First Step Next. The effects should be in the range of the effectiveness studies rather than the efficacy studies. It is also likely to yield positive results for students with ADHD and ASD.
Overall, First Step Next is a well-researched, empirically-supported intervention for children from preschool through third grade. Teachers report satisfaction with the program and the ease of implementation. It is noteworthy that the developers of First Step Next have meticulously evaluated the program at each step of its development. It serves as an exemplar of how to develop intervention packages that are ready for schools to implement.
Citation:
Frey, A. J., Small, J. W., Walker, H. M., Mitchell, B., Seeley, J. R., Feil, E. G., … & Forness, S. R. (2022). First Step Next: A Best-Evidence Synthesis of Replication Randomized Controlled Trials From 2009 to 2021. Remedial and Special Education, 07419325211068145.
Link for article:
https://journals-sagepub-com.dist.lib.usu.edu/doi/full/10.1177/07419325211068145
October 13, 2022
The COVID pandemic required educators to move rapidly from in-person classes to remote learning. Many educators had little experience with online instruction, especially at the scale necessary to educate all students. The question became, what impact would this rapid change in instructional approaches have on student achievement? Education Week has reported the results of the National Assessment of Education Progress (NAEP) testing data from the spring of 2022. The previous testing period was in the spring of 2020, just before the pandemic resulted in the widespread closure of schools and the shift to remote learning. Comparing data from 2020 with scores from 2022 clearly shows that COVID significantly negatively impacted education nationally.
Overall, math scores dropped by 7 points. This is the first decline in math scores in the fifty years of assessing academic achievement by the NAEP. Reading scores fell by 9 points, the largest drop since 1990. For example, White and Black, students all saw decreases in math and reading; however, these groups had substantial differences. In math, White students’ scores fell by 5 points. Black students scores dropped 13 points. The gap between these two groups increased from 25 points to 33 points between 2020 and 2022. Students across all regions of the country had lower scores in math; every region except the West had lower reading scores.
Figure 1 describes changes across achievement levels in math between 2020 and 2022. Students in the lower-performing groups were most adversely effects by the pandemic. For example, students in the 90th percentile in 2020 dropped 3 points in 2022; students at the 25th percentile in 2020 dropped by 11 points in 2022.

Figure 1: Changes in math scores for nine-year-old students across achievement levels from 2020-2022. Image from National Center for Education Statistics.
The data in Figure 2 reflect the changes in reading across achievement levels. The pattern is the same as in math. The pandemic negatively impacted students in the lower-performing groups more significantly.
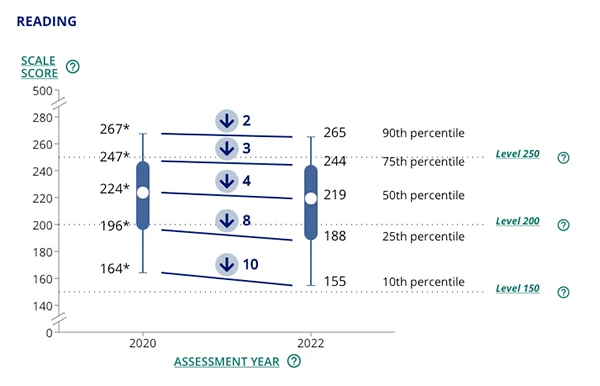
Figure 2: Scores for nine-year-old students across achievement levels from 2020-2022. Image from National Center for Education Statistics.
It is unclear what accounts for the differences across the achievement groups, but one possible contributing factor was access to support for remote learning. For students scoring at the 75th percentile or higher, 83% reported having access to a desktop, laptop, or tablet all the time during remote learning. For students at the 25th percentile or lower, only 58% reported that they had the same access. These data are suggestive and do not necessarily reflect a causal relation. Considerably more research is needed to establish a causal role.
Please read the complete report in Education Week for more data regarding the impact of the COVID pandemic.
Citation:
Schwartz, S. (Sept. 1, 2022) Students Math and Reading Plummet, Erasing Gains, National Assessment Finds. Education Week.
Link to article:
September 9, 2022
Educators are always looking for instructional methods that are effective and efficient. Effective interventions can vary with respect to how rapidly content is learned. Efficient methods result in rapid learning of content. Part of determining learning is establishing a mastery criterion (i.e., 90% correct over a specified number of days). The most common method for determining mastery is to establish a mastery criterion for a set of instructional content (i.e., sight words, math facts). Mastery is assumed when the percent correct score is at or above the mastery level (i.e., 90% correct). This approach may obscure that some items in the set have not been mastered, but the aggregate score is at mastery. Another way to determine mastery is to calculate it at the level of the individual item (individual sight words). Once an item is mastered, it is removed from the list, and a new item is added. The question is which approach results in greater learning? A recent study by Wong and Fienup (2022) was designed to answer the question, at least for sight words. Their results suggest that the individual item approach resulted in greater acquisition and required less time to achieve mastery of an item. An additional analysis in this small study was to compare the retention of items four weeks following the end of teaching. There were very small differences between the two approaches to instruction. For one participant, maintenance was 100% for both approaches. For a second participant, the individual item approach resulted in better maintenance scores. For the third participant, the set approach produced a slightly higher maintenance score.
The results of this study are important in that they suggest that the commonly used set approach is less efficient at producing initial acquisition and has no advantage with respect to the maintenance of mastered items. Implementing the individual item approach could be relatively simple. The only real change would be to analyze responding at the level of the individual item rather than aggregating data at the set level. As the student progresses through additional set lists and more difficult items are added, the student’s failure to have mastered all of the content may lead to more errors and failure experiences. If we can accelerate learning by making mastery decisions at the individual item level, consider how much more can be learned over the course of a school year. These simple changes may result in great benefit to students.
Citation:
Wong, K. K., & Fienup, D. M. (2022). Units of analysis in acquisition‐performance criteria for “mastery”: A systematic replication. Journal of Applied Behavior Analysis.
Link to article:
September 9, 2022
Teacher evaluation is ubiquitous in US public schools. Typically, it involves a principal observing a teacher several times over the course of a school year. In an effort to standardize ratings, a scoring rubric is followed; however, the ratings are ultimately subjective, and the items on the rubric are subject to interpretation. One of the primary functions of teacher evaluations is to provide accurate feedback to teachers and encourage improvement when needed. A persistent question regarding teacher evaluation is if evaluation scores are inflated? There is some research suggesting this is the case; however, little is known about the reasons for inflating the scores. A recent study by Jones, Bergin, and Murphy (2022) attempted to determine if principals inflated scores and, if so, their motivation for doing so. Using a mixed method approach that utilized both focus groups and a survey of a large group of principals, principals identified several goals in addition to providing accurate ratings. Those additional goals were to (1) keep teachers open to growth-promoting feedback, (2) support teachers’ morale and foster positive relationships, (3) avoid difficult conversations, (4) maintain self-efficacy as an instructional leader, and (5) manage limited time wisely. These additional goals were offered as reasons to inflate scores, even if by small amounts. For the most part, these are worthy goals and suggest that teacher evaluation is more complicated than simply applying a scoring rubric while observing a teacher.
In general, principals are more likely to inflate ratings if they are linked to high-stakes outcomes such as requiring an improvement plan for the teacher or making retention decisions. Principals are reluctant to give lower ratings if it results in them having to engage in activities that require more time, such as additional meetings to develop improvement plans or to carefully document the reasons for recommending against retention. Also, by inflating ratings, principals avoid having difficult conversations with a teacher.
The principals’ worry was that if they gave a lower rating, teachers would become defensive and less open to feedback and growth. They also feared that low ratings would lover staff morale and positive relationships would be harmed. These concerns are not without merit. On a rating scale that ranges from 1-7, a rating of 4 is considered a low rating by the teacher, but a 5 is considered acceptable. The difference of one point is considered small by the principal. Since there is room for judgment in the scoring rubric giving a more positive rating will do no harm from the principal’s perspective.
Based on the research by Jones, Bergin, and Murphy (2022), these situations are relatively common. Overlooked in the principals’ perspective is that there is little consideration given to the impact these decisions have on students. It is unknown what effect these decisions are having on student outcomes. For a complete understanding of the evaluation of teachers, it is important to understand all of the effects of evaluations of teachers.
Citation for article:
Jones, E., Bergin, C., & Murphy, B. (2022). Principals may inflate teacher evaluation scores to achieve important goals. Educational Assessment, Evaluation, and Accountability, 34(1), 57-88.
Link for the article:
September 9, 2022
Teachers report that behavior management is one of the greatest challenges in the profession and they feel unprepared to deal with difficult behavior. One of the questions to be answered is where do teachers get information about behavior management? Recently, Beahm, Yan, and Cook (2021) conducted a mixed methods study to answer this question. It is important that teachers rely on practices that have a good empirical base. Failure to do so may have no effect or make the problem worse. If we understand the resources teachers rely on and why, then more systematic, informed approaches can be taken to assure they are relying on credible information. This may help us close the research-to-practice gap. Beahm et al. surveyed 238 teachers to learn about the resources they relied on for behavior management information. They also did focus groups with 10 of the teachers to gain insight into why they preferred some resources more than others. Teachers preferred getting information from colleagues by a large margin (91%) relative to any other source, including research articles, the internet, administrators, and professional development. Ninety-two percent reported the information from colleagues was understandable. Teachers had a positive perception of all attributes of the information from colleagues (trustworthiness, usability, accessibility, and understandability). Participants in the focus group reported that colleagues were understandable because they used familiar language and avoided jargon. In addition, colleagues were perceived to provide exact details on implementing the recommended practice.
Participants in the focus group indicated colleagues were more trustworthy because they were going to only describe practices they had used successfully. The participants also thought that colleagues had knowledge of their classrooms and students.
Finally, colleagues were perceived as providing information that was usable because they likely had developed easy-to-use forms and data collection systems. In other words, the colleagues were an efficient source of information, saving the classroom teacher from the extra work of developing forms and data sheets for themselves.
These data are consistent with the recommendations of Rogers (2003), who reported that practices were more likely to be adopted if they were recommended by a credible source. Colleagues use language that is already familiar and have in-depth knowledge of the circumstances that the teacher is concerned with.
Researchers will be well served to attend to these data if they want to close the research-to-practice gap. They should develop materials that rely on the language teachers already use, create step-by-step user guides, and provide video samples of the practice in actual application. Finally, researchers should recruit teachers to be champions for a research-based practice rather than relying on researchers to disseminate practices. This would represent a change in the way researchers go about doing business. It will be worth the effort because the research-to-practice gap has been persistent for decades. It is time we try new ways to disseminate effective practices.
Citation:
Beahm, L. A., Yan, X., & Cook, B. G. (2021). Where Do Teachers Go for Behavior Management Strategies? Education and Treatment of Children, 44(3), 201-213.
Link to article:
References: Rogers, E. M. (2003). Diffusion of Innovations (5th ed.). New York: Free Press